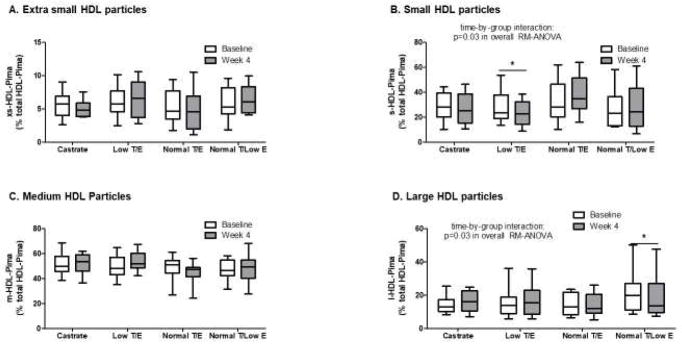
Figure 5.
Baseline and end-of-treatment HDL particle size distribution in all study subjects classified by treatment group. No differences across groups were observed for extra small HDL particle fraction (xs-HDL-Pima) (A), but a significant treatment effect was seen for small HDL particles (s-HDL-Pima) (B) with a significant decrease in small HDL particle fraction in the Low T/E group. No differences across groups were evident for medium HDL particle fraction (m-HDL-Pima) (C), but change in the fraction of large HDL particles (l-HDL-Pima) did differ across groups, with a significant decrease in large HDL particle fraction among subjects in the Normal E/Low E group. Data are presented as a % of total HDL particle concentration (total HDL-Pima). Whiskers = minimum to maximum values. *p<0.05 for within-group change

