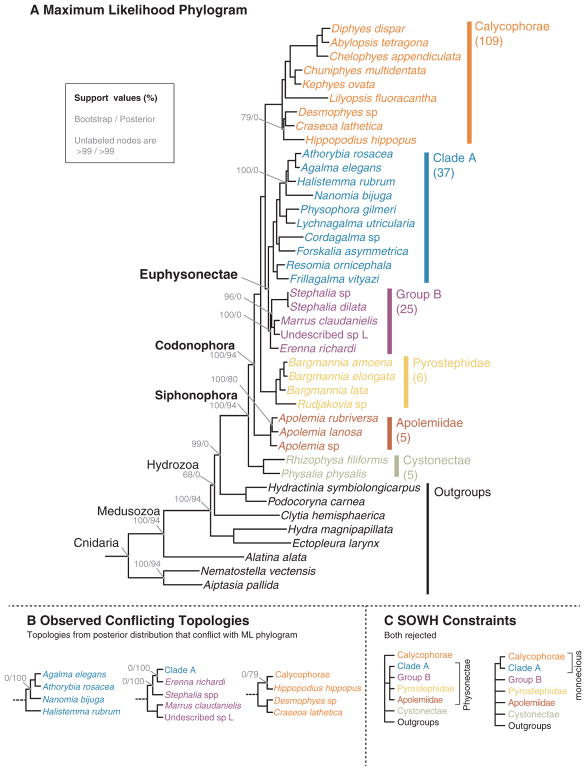
Fig. 3.
(A) Maximum likelihood (ML) phylogram with bipartition frequencies from the ML bootstraps and the Bayesian posterior distribution of trees. Unlabeled nodes have support > 0.99 for both bootstraps and posteriors. The numbers of valid described species estimated to be based in each clade based on taxonomy are shown below each clade name on the right. (B) The topologies found in the posterior distribution of trees that conflict with the ML tree. (C) The topologies evaluated by the SOWH tests. For more details on the SOWH topologies refer to Fig. S2.

