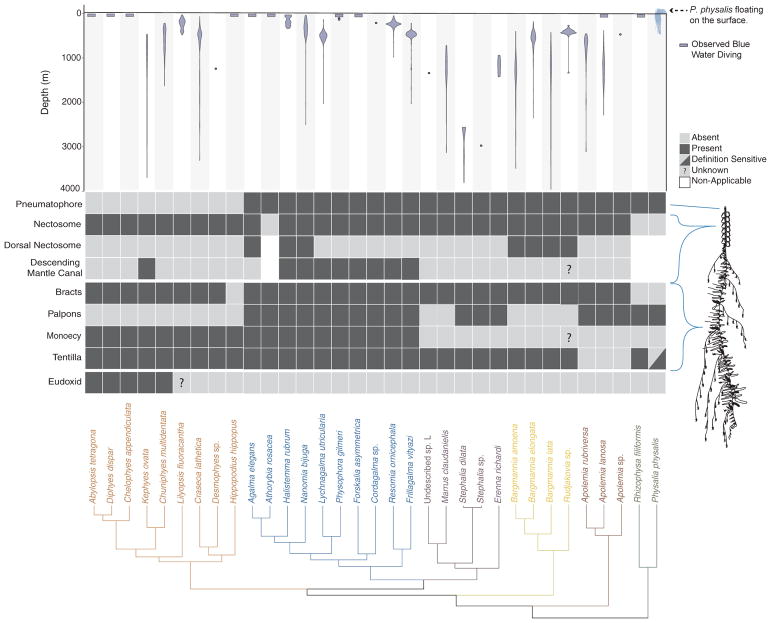
Fig. 4.
Siphonophore phylogeny showing the distribution of the main anatomical characters and the bathymetric distributions of the different species. Bottom: siphonophore phylogeny, colored by clade. Middle: diagram showing the presence/absence of traits across Siphonophora, with the physical location of the trait shown on a schematic of Nanomia bijuga (schematic by Freya Goetz). Top: Bathymetric distribution of siphonophore species. Physalia illustration by Noah Schlottman, taken from http://phylopic.org/. (For interpretation of the references to colour in this figure legend, the reader is referred to the web version of this article.)

