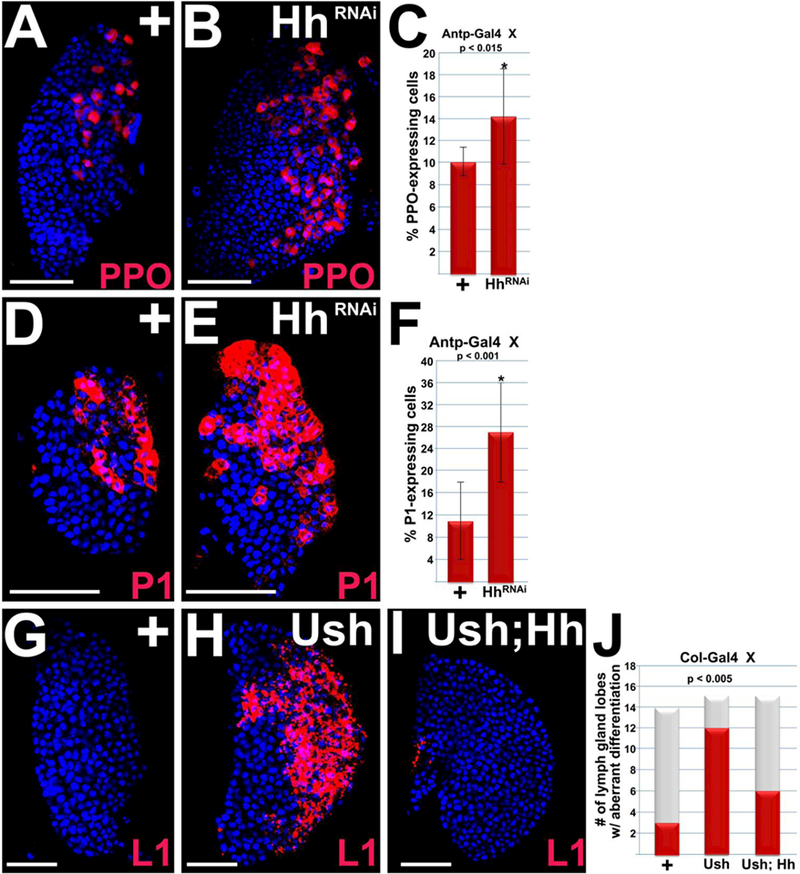
Figure 3. Hedgehog signaling blocks blood cell differentiation.

(A–F) Hh signaling was disrupted by using Antp-Gal44 to drive UAS-hhRNAi in the PSC. This resulted in a significant increase in the number of crystal cells and plasmatocytes in mid-third instar larvae. (A,B) Crystal cells are marked with ProPO (PPO) and (D,E) plasmatocytes are marked with PI. (C,F) Histograms showing the results of the statistical analyses. Student’s t-test; error bars show standard deviation; P values are as shown; (C) control and HhRNAi (n=10); (F) control and HhRNAi (n=12). (G–J) Col-Gal4 was used to express UAS-ush or co-express UAS-ush;UAS-hh in the PSC of later third instar larvae. (G,H) Mis-expressing Ush resulted in a significant increase in lamellocyte differentiation, (G–I) which was significantly repressed by co-expressing Ush and Hh. (G–I) Lamellocytes are marked with LI. (J) Histogram showing the results of the statistical analyses. Chi-square test; P value is as shown; Col-Gal4/+ (n=14); Col>Ush (n= 15); Col>Ush;Hh (n=15). Lymph glands are counterstained with Dapi. Scale bars: 50 μm.
