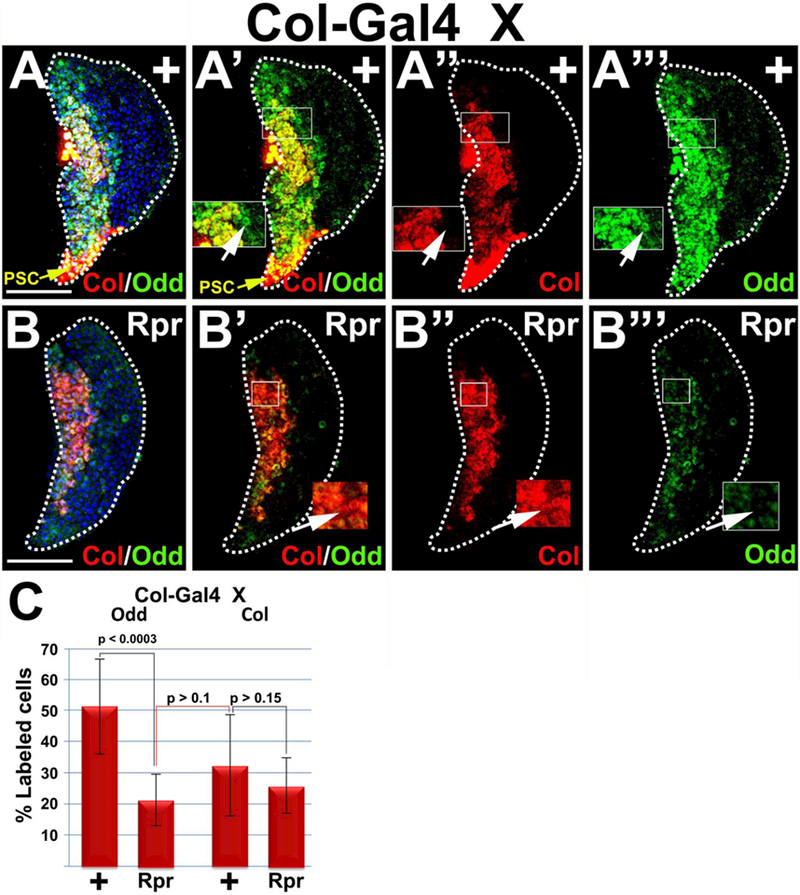
Figure 7. The PSC is required to maintain the complement of Odd-positive, but not Col-positive prohemocytes.

Ablation of the PSC (Col>Rpr) results in a significant reduction in the percentage of Odd-positive prohemocytes, but not the percentage of Col-positive cells. (A-A’”) Controls and (B-B’”) Col>Rpr. A,A’,B,B’) Lymph glands showing Col and Odd expression, (A, A’) PSC marked with yellow arrows, (A,B) counterstained with Dapi, (A”,B”) lymph glands showing only Col expression, (A’”, B’”) lymph glands showing only Odd expression. (A’-A’”) Insets showing cells that express Odd but not Col, marked with arrow. (B’-B’”) Insets showing cells with predominantly Col expression but with reduced Odd expression, marked with arrow. (C) Histogram showing that Odd-positive prohemocytes are significantly reduced in response to PSC ablation; whereas Col-positive prohemocytes are not significantly reduced in response to PSC ablation. Black connecting lines compare percentage of Odd control and experimental samples or Col control and experimental samples. Red connecting line compares percentage of Odd-positive cells in PSC ablated lymph glands with Col-positive cells in control lymph glands. Student’s t-test; error bars show standard deviation; P values are as shown; control and Rpr (n=10). White dotted lines delineate the entire lymph gland. Scale bars: 50 μm. Mid-third instar larvae.
