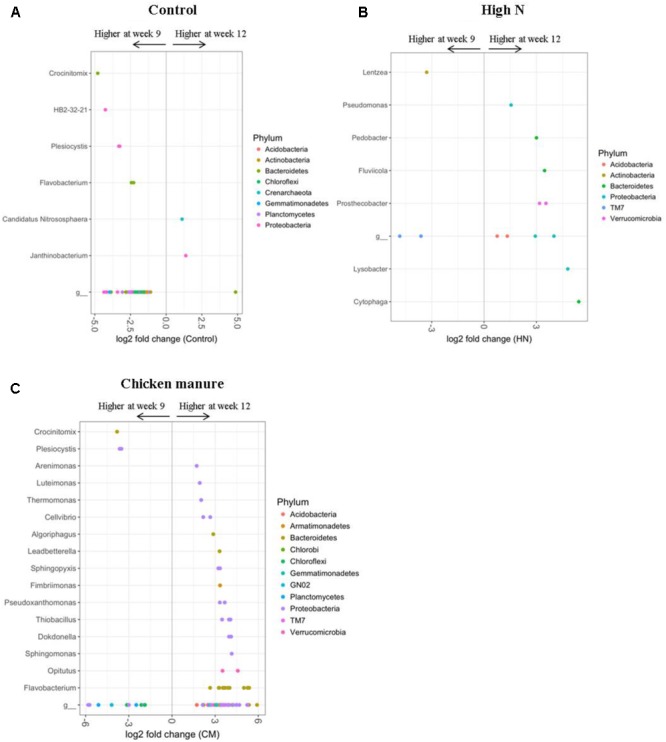
FIGURE 6.

DESeq2 analysis results indicating the fold-change of bacterial genera in rhizosphere communities of 12-week-old plants relative to 9-week-old plants within the (A) control, (B) HN, and (C) CM treatments (LN treatment only had one significantly different classified OUT at the genus level) (p < 0.001). “g” Represents OTUs that were not classified at the genus level.
