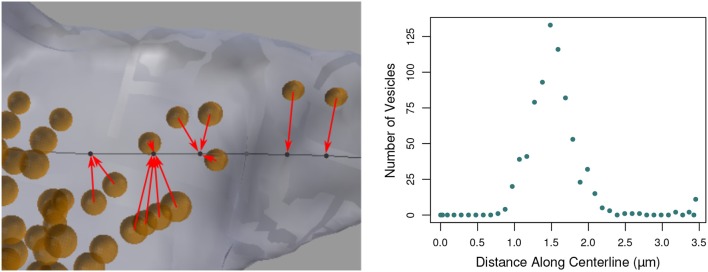
Figure 11.
(Left) Vesicles (orange) projected to their nearest vertices on the axon centerline (black; for clarity, only a subset of the projection arrows are shown). The tool counts the number of vesicles that project to each centerline vertex. (Right) The number of vesicles projected to each centerline vertex along the length of the entire axon, shown in Figure 1.

