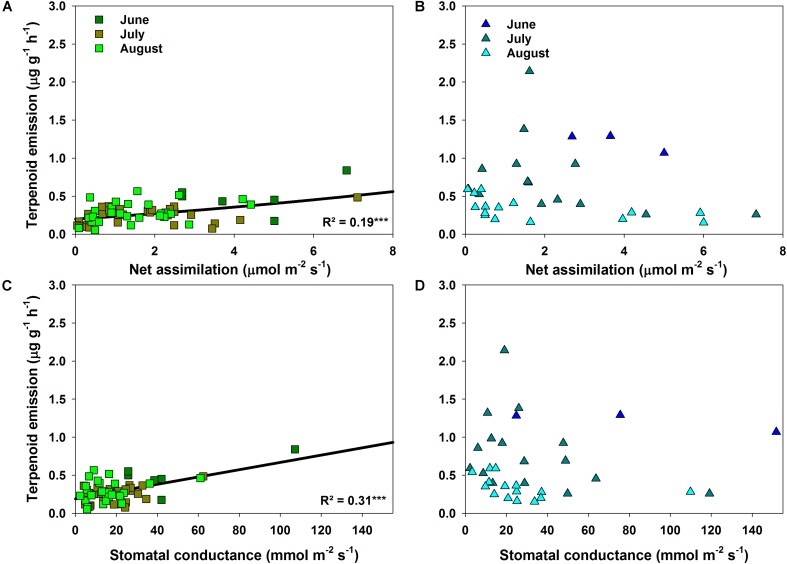
FIGURE 5.
Relationship of measured terpenoid emission rates for Q. suber (A,C) and standardized terpenoid emission rates for C. ladanifer (B,D) to net assimilation rate and stomatal conductance. Significant trends (linear and exponential regressions) are illustrated by solid lines at a significance levels of ∗p < 0.05, ∗∗p < 0.01, ∗∗∗p < 0.001.

