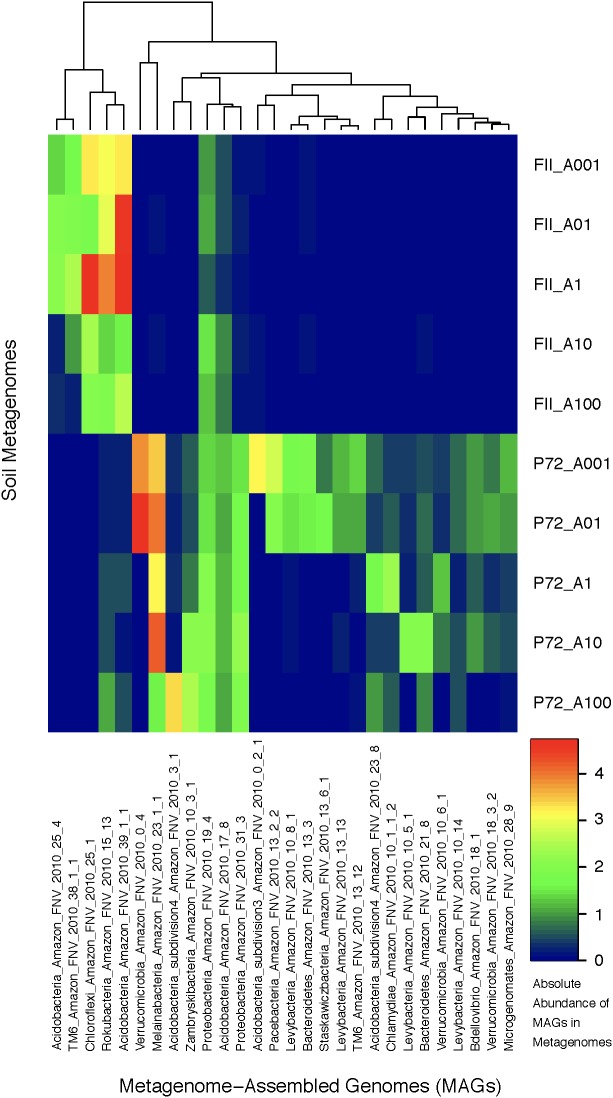
FIGURE 3.
A heatmap of the absolute abundance of MAGs in each metagenome sample from this study. Absolute abundance means the number of the specific genome found in each soil metagenome; an absolute abundance of four would mean that four instances of that genome are found in that specific metagenome. The x-axis depicts the MAGs labeled with the following scheme: Taxonomic association, location of sampling (Amazon FNV), year of sampling (2010), and bin number from anvi’o. The y-axis are the soil metagenome samples for rainforest (FII) or cattle pasture (P72), differentiated by the location on a 100 m transect indicating the distance from the starting location in meters. The clustering at the top of the graph is based on hierarchical clustering.

