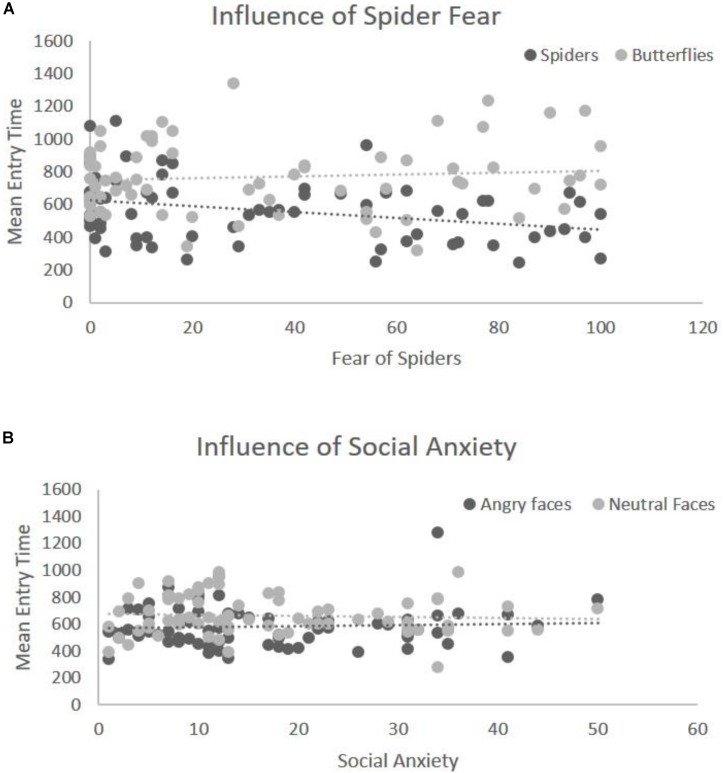
FIGURE 3.
Illustration of covariation between Emotion and fear level. (A) Significant interaction of entry time with spider fear for the first block (spiders vs. butterflies). The y-axis represents the mean entry time across trials and the x-axis represents the questionnaire scores for fear of spiders (range 0–126). Dots represent the type of stimulus and the lines represent the regression lines (B) interaction of entry time with social anxiety for the second block (angry faces vs. neutral faces). The y-axis represents the mean entry time across trials and the x-axis represents the questionnaire scores for social anxiety (range 0–60). Dots represent the type of stimulus and the lines represent the regression lines.

