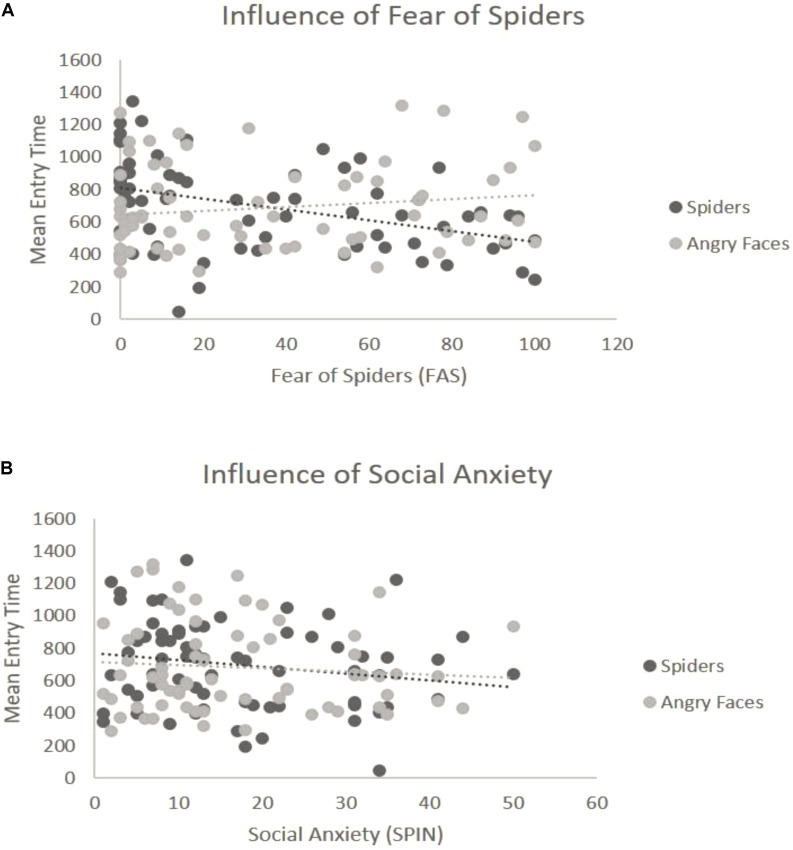
FIGURE 4.
Interaction of emotion with reported levels of fear for the third block (spiders vs. angry faces). (A) Significant interaction with spider fear. The y-axis represents the mean entry time across trials and the x-axis represents the questionnaire scores for fear of spiders (range 0–126). Dots represent the type of stimulus and the lines represent the regression lines. (B) Non-significant interaction with social anxiety. The y-axis represents the mean entry time across trials and the x-axis represents the questionnaire scores for social anxiety (range 0–60). Dots represent the type of stimulus and the lines represent the regression lines.

