Figure 9.

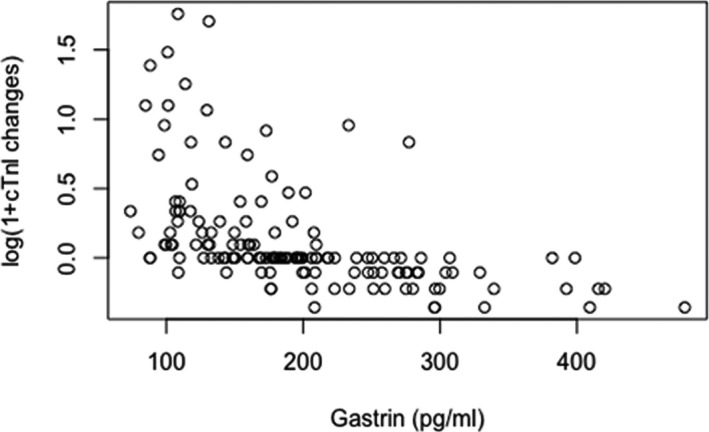
Scatter plot of the changes in log‐transformed serum cardiac troponin I (cTnI) and gastrin levels of unstable angina pectoris patients undergoing percutaneous coronary intervention (PCI). The y‐axis is log(post‐PCI)−log(pre‐PCI).

Scatter plot of the changes in log‐transformed serum cardiac troponin I (cTnI) and gastrin levels of unstable angina pectoris patients undergoing percutaneous coronary intervention (PCI). The y‐axis is log(post‐PCI)−log(pre‐PCI).