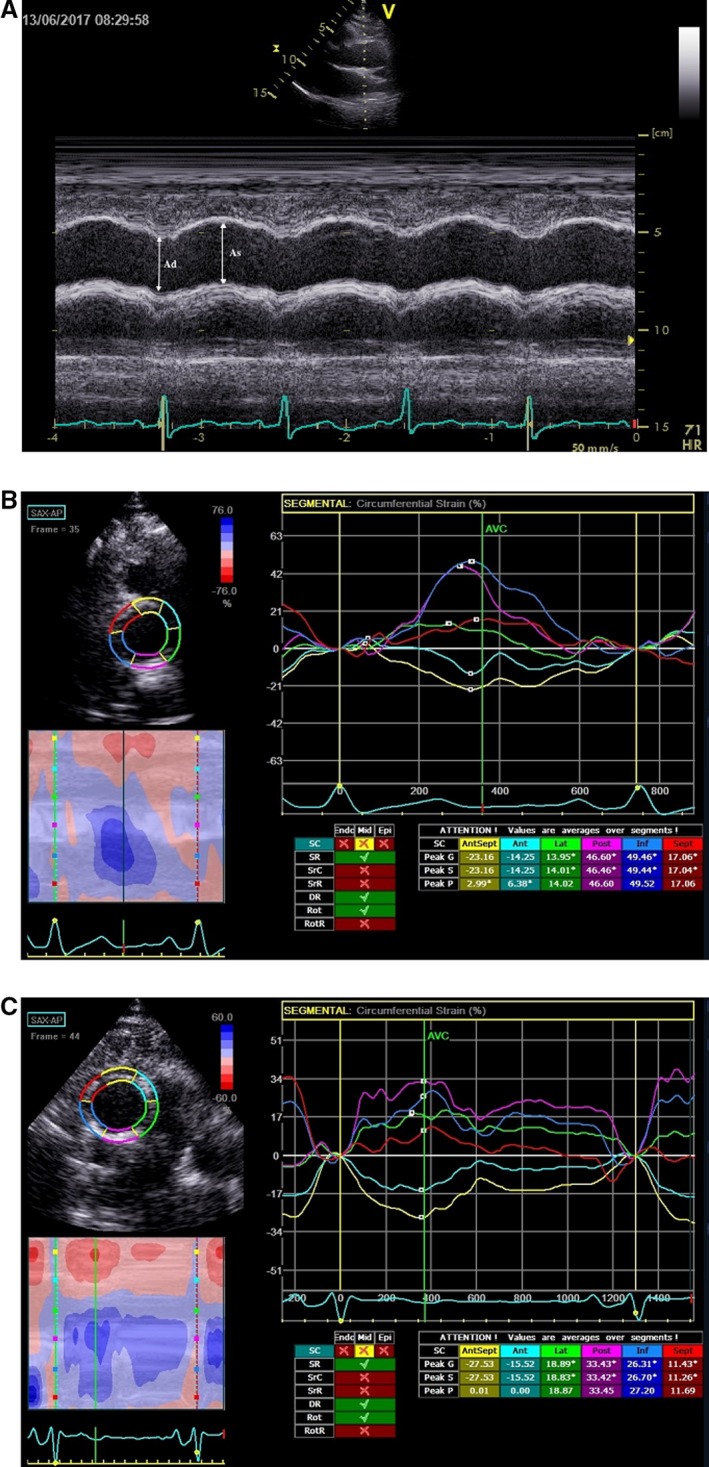
Figure 1.

A, M‐mode 2D‐guided aortic image obtained from the aortic long‐axis view. As, ascending aortic diameter in systole; Ad, ascending aortic diameter in diastole. B, Representative CAAS curves in a patient without significant coronary stenosis. Peak values of CAAS in each color‐coded curve were measured, and then the global CAAS was calculated as the mean of 6 peak values. This patient had a global CAAS of 14.94%. C, Representative CAAS curves in a patient with significant coronary stenosis. This patient had a global CAAS of 7.8%. 2D indicates 2‐dimensional; CAAS, circumferential ascending aortic strain.
