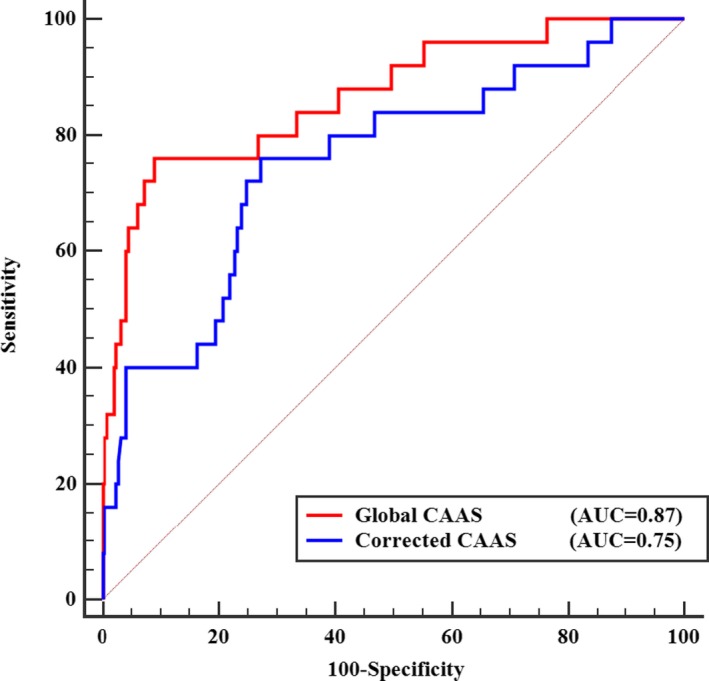
Figure 4.

ROC curves of global CAAS and corrected CAAS for identifying 3‐vessel CAD. Red line represents the ROC curve for global CAAS. Blue line represents the ROC curve for corrected CAAS. AUC indicates area under ROC curve; CAAS, circumferential ascending aortic strain; CAD, coronary artery disease; ROC, receiver operating characteristic.
