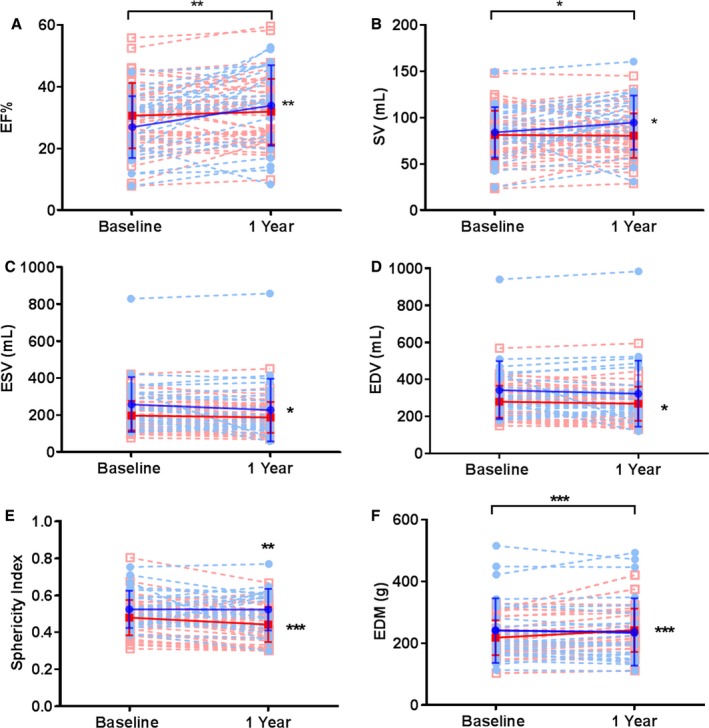
Figure 1.

Changes in cardiac function in DCM (blue) and ICM (red) patients. A, EF increased from baseline in DCM (blue circles) by 7 EF units (2.9, 11.0; P=0.002), but not in ICM (red squares). DCM group showed a significant improvement over time in (B) stroke volume by 10.6 mL (95% CI, 0.2, 21.0; P=0.046) and (C) end‐systolic volume by −17.8 mL (interquartile range, −54.5, 17.0; P=0.049). However, the ICM group improved in (D) end‐diastolic volume by −8.32 mL (95% CI: −21.0, −0.3; P=0.05) from baseline, whereas DCM did not. E, Sphericity index improved in ICM by −0.04% (95% CI, −0.06, −0.02; P=0.0002). F, End‐diastolic mass increased in ICM by 23.1 g (95% 13.9, 32.2; P<0.0001) at follow‐up, with a significant difference between both groups (P=0.0003). DCM indicates dilated cardiomyopathy; ED, end diastolic; EDV, end‐diastolic volume; EF, ejection fraction; ESV, end‐systolic volume; ICM, ischemic cardiomyopathy; SV, stroke volume.
