
Figure 2.
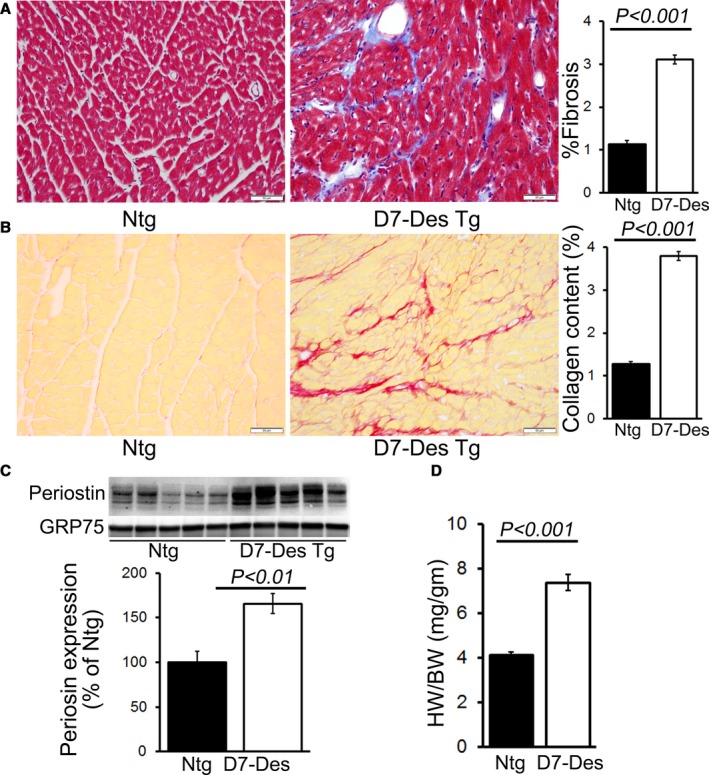
D7‐Des expression results in cardiac hypertrophy and fibrosis. A, Representative micrographs of Masson's trichrome‐stained LV myocardium and quantification of the cardiac fibrosis in Ntg and D7‐Des Tg hearts (n=5 mice per group). B, Representative micrographs of Sirius Red–stained LV myocardium and quantification of the myocardial collagen deposition in Ntg and D7‐Des Tg hearts (n=5 mice per group). C, Representative Western blot and densitometric quantification showing significantly increased expression of periostin in D7‐Des Tg hearts (n=5 mice per group). D, Heart‐weight‐to‐body‐weight ratios (HW/BW) showing LV hypertrophy in the D7‐Des Tg hearts (n≥6 or more mice per group). Bars represent mean±SEM. P values were determined by Tukey's post hoc test. Scale bars: 50 μm. D7‐Des Tg indicates mutant desmin transgenic mouse; LV, left ventricular; Ntg, non‐transgenic.