
Figure 2.
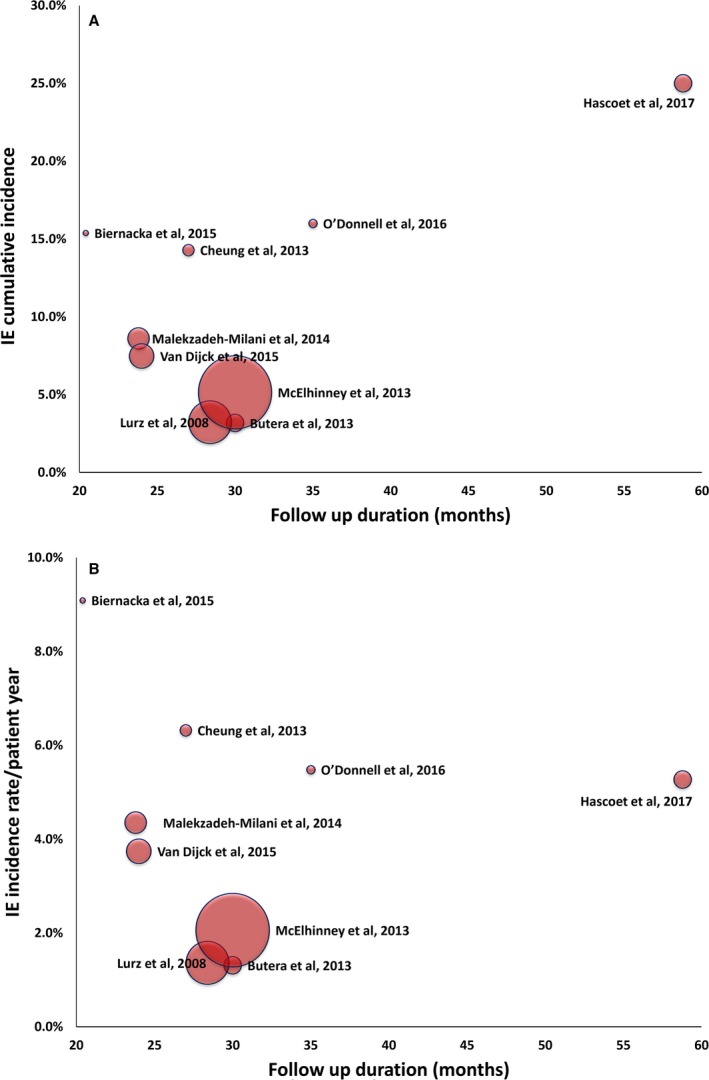
Scatter plots of the cumulative (A) and annualized (B) incidence rate of infective endocarditis (IE) plotted against the follow‐up duration (in months) of the individual studies14, 15, 16, 17, 18, 19, 20, 21, 22 (Spearman correlation coefficient=0.16 and −0.27, P>0.05 for both). Dot size is proportionate to the sample size (number of patients) of each study.