Figure 3.

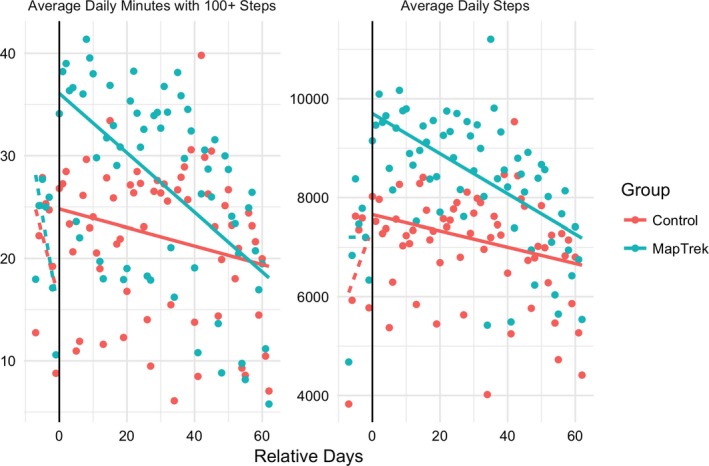
Average daily minutes with 100+ steps and average daily steps by group over the course of the intervention. Baseline is represented in data point to the left of the horizontal line marked “0,” and intervention days are to the right.

Average daily minutes with 100+ steps and average daily steps by group over the course of the intervention. Baseline is represented in data point to the left of the horizontal line marked “0,” and intervention days are to the right.