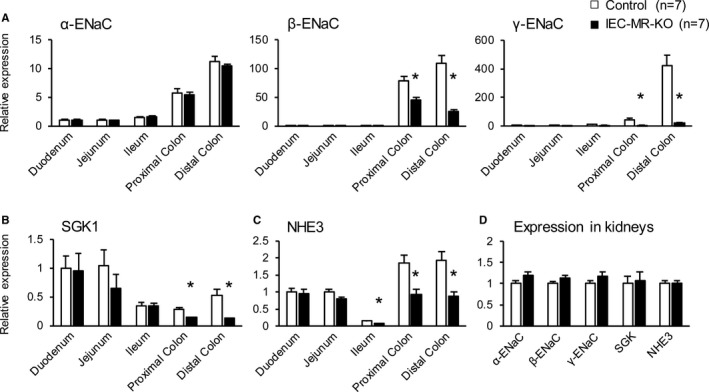
Figure 1.

The mRNA expression levels of the ENaC family, SGK1, and NHE3 in the kidneys and various intestinal portions. The mRNA expression of α‐, β‐, and γ‐ENaC (A), SGK1 (B), and NHE3 (C) in various intestinal parts and in the kidneys (D), as measured by quantitative polymerase chain reaction. Gene expression in each intestinal portion is normalized to that of control mouse duodenum. The number of animals per group is indicated in parentheses. Data are presented as mean±SEM. *P<0.05 vs control. ENaC indicates epithelial sodium channel; IEC‐MR‐KO, intestinal epithelial cell–specific mineralocorticoid receptor knockout; NHE3, sodium–hydrogen exchanger 3; SGK1, serum/glucocorticoid regulated kinase 1.
