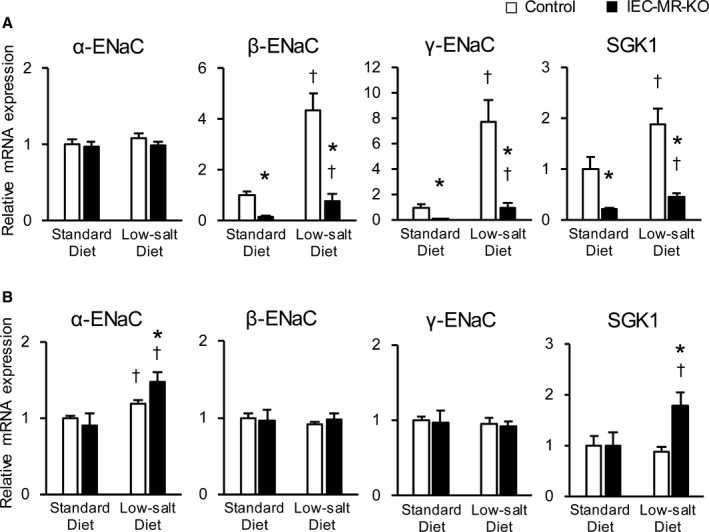
Figure 2.

The mRNA expression levels of ENaC family members and SGK1 in the distal colon and kidneys with a low‐salt diet. The mRNA expression of ENaC and SGK1 in the distal colon (A) and in the kidneys (B) with a standard diet and a low‐salt diet, as measured by quantitative polymerase chain reaction. Gene expression is normalized to that of 18S rRNA and is expressed relative to that in control mice on a standard diet. Data are presented as mean±SEM. n=7 per genotype and group. P<0.05 vs *control, †standard diet. ENaC indicates epithelial sodium channel; IEC‐MR‐KO, intestinal epithelial cell–specific mineralocorticoid receptor knockout; SGK1, serum/glucocorticoid regulated kinase 1.
