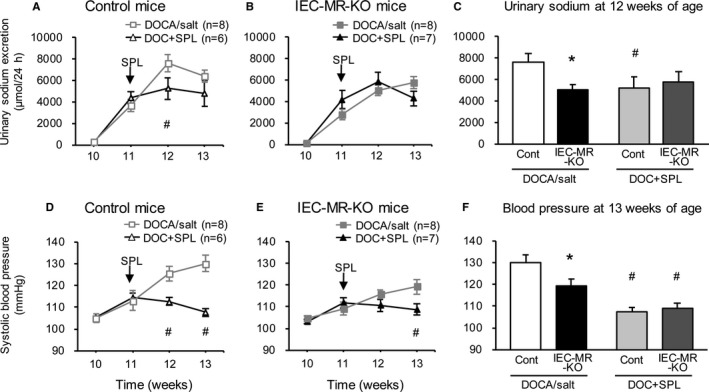
Figure 4.

Changes in urinary sodium excretion and blood pressure under DOC+SPL treatment. Gray lines indicate the changes under DOCA/salt treatment, as shown in Figure 3C and 3I. Black lines indicate the changes under DOC+SPL treatment. Urinary sodium excretion (A and B) and systolic blood pressure (D and E) in control and IEC‐MR‐KO mice. C, Urinary sodium excretion in all groups at 12 weeks of age. F, Blood pressure in all groups at 13 weeks of age. Arrows indicate the start of spironolactone treatment. Data are presented as mean±SEM. P<0.05 vs *control (Cont), # DOCA/salt. DOC+SPL indicates deoxycorticosterone acetate/salt treatment plus spironolactone; DOCA, deoxycorticosterone acetate; IEC‐MR‐KO, intestinal epithelial cell–specific mineralocorticoid receptor knockout.
