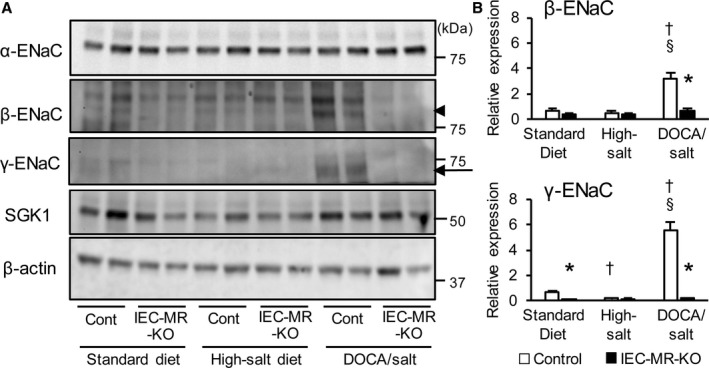
Figure 6.

Protein expression levels of ENaC family and SGK1 in the distal colon. A, Representative immunoblot showing the protein expression of each gene. The arrowhead indicates the β‐ENaC band and the arrow indicates the broad bands centered around 70 kDa, which represent the active γ‐ENaC form. B, Quantification of β‐ and γ‐ENaC protein expression levels after analysis using ImageJ. Levels are normalized to those of β‐actin and expressed relative to that in control mice on a standard diet. Data are presented as mean±SEM. n=5 per genotype and group. P<0.05 vs *control, †standard diet, §high‐salt diet. DOCA indicates deoxycorticosterone acetate; ENaC, epithelial sodium channel; IEC‐MR‐KO, intestinal epithelial cell–specific mineralocorticoid receptor knockout; SGK1, serum/glucocorticoid regulated kinase 1.
