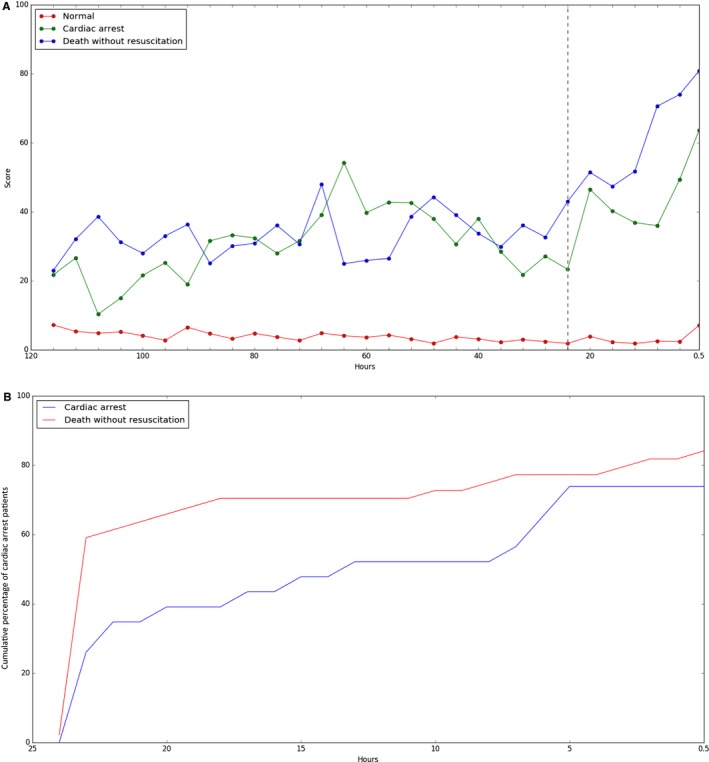
Figure 6.

Trend of the DEWS score. A, The change in the mean of the DEWS scores over time as a group of patients. B, Cumulative percentage of cardiac arrest patients on detection time before event. We used the DEWS with sensitivity 70% for this plot. DEWS indicates deep learning–based early warning system.
