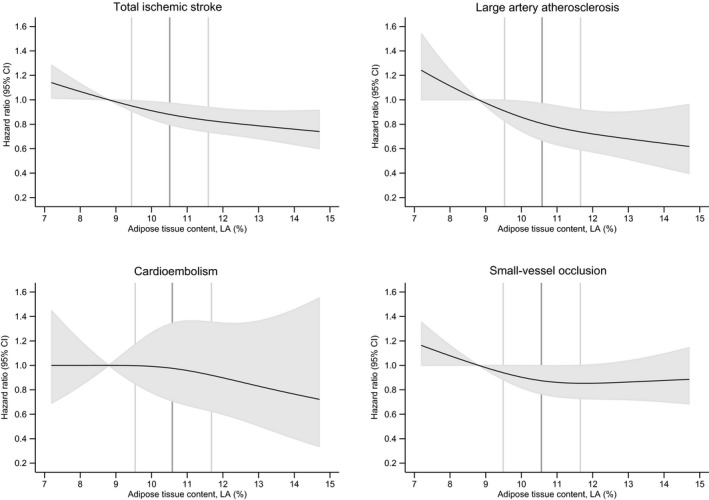
Figure 2.

Spline curves for adipose tissue content of linoleic acid (LA) in percentage of total fatty acids and the risk of incident total ischemic stroke, large artery atherosclerosis, cardioembolism, and small‐vessel occlusion. Data presented for model 1B, adjusting for educational and lifestyle factors. The 2.5 to 97.5 percentile of LA is shown, with the 12.5 percentile (median in the lowest quartile) as reference. Black lines show the hazard ratios and the shaded grey areas show the 95% confidence intervals. The 25, 50, and 75 percentiles of LA are shown by vertical lines.
