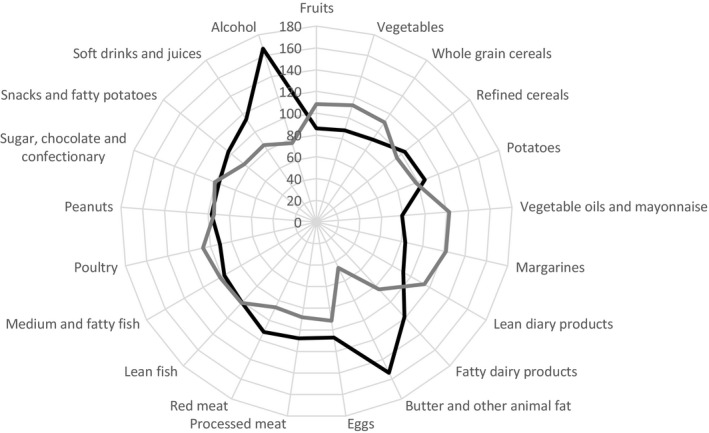
Figure 3.

Radar chart illustrating the percentage‐wise difference in energy‐adjusted median intake of 21 groups of foods and beverages for participants in the subcohort with the lowest and the highest adipose tissue content of linoleic acid. First quartile is illustrated with a black line and fourth quartile with a gray line.
