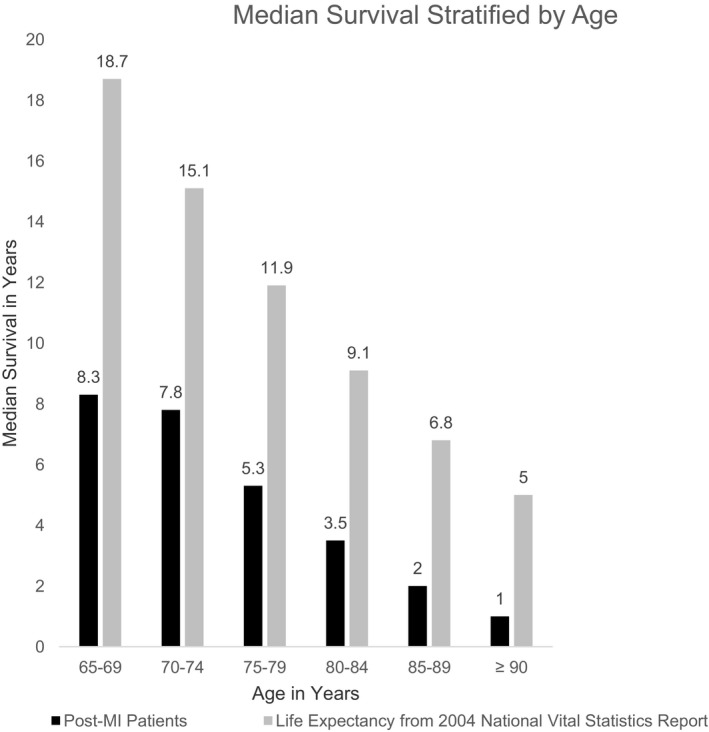
Figure 3.

Median survival in years, stratified by age group at presentation for the index MI. The black bars reflect post‐MI patients in the CRUSADE‐CMS‐linked data set. The gray bars represent expected lifespan from the United States National Vital Statistics Report.9 The largest difference in survival is noted among the relatively younger patients. Data from the 2004 National Vital Statistics Report are presented to provide context. The gray bars reflect expected lifespan of adults by ascending order of age: 65, 70, 75, 80, 85, and 90 years. Direct comparisons cannot be made between the median survival among our cohort and the expected lifespan because of the differences in age categorization. The sample sizes for the post‐MI patients depicted in the black bars are provided in Table S1. CMS indicates Centers for Medicare and Medicaid Services; MI, myocardial infarction.
