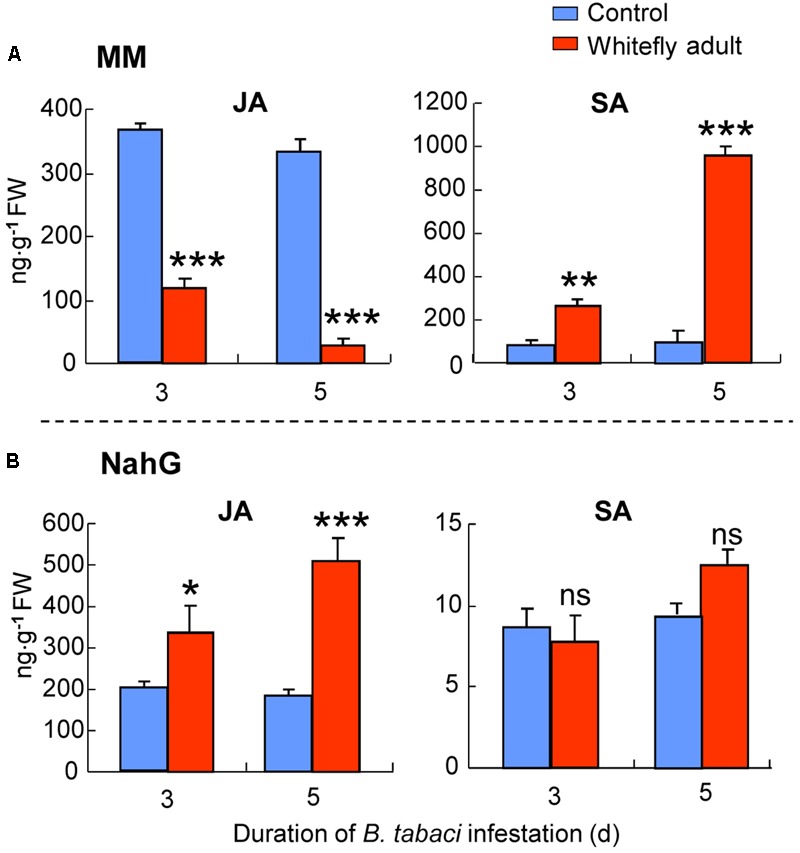
FIGURE 7.

JA and SA levels in MM (A) or NahG plants (B) as affected by B. tabaci infestation under semi-field conditions. Values are means (±SE) of three biological replicates. Asterisks above bars indicated significant differences compared to the non-infested control (two-way ANOVA; ∗P < 0.05; ∗∗P < 0.01; ∗∗∗P < 0.001). ns, not significant. FW means fresh weight.
