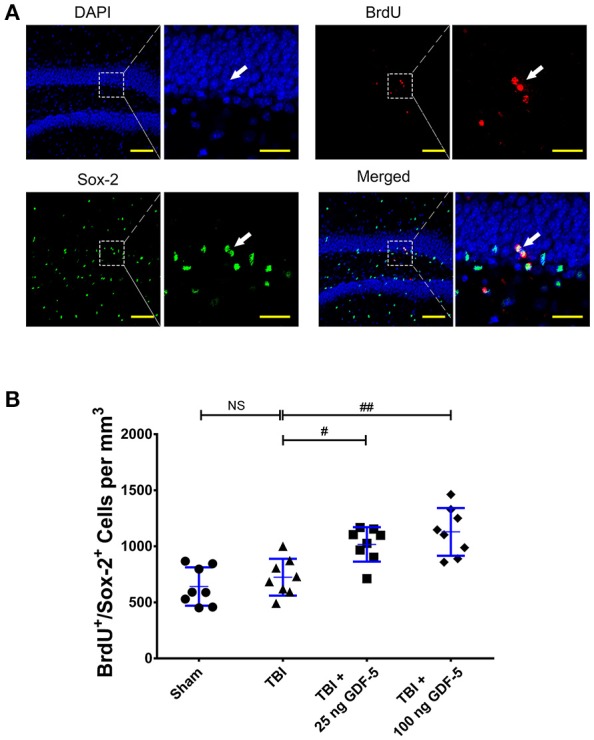
Figure 2.

GDF-5 treatment increased the number of BrdU+/Sox-2+ cells in the DG area 7 days after TBI. (A) Representative confocal images (scale bars represent 100 μm). Magnified views on the right indicate the boxed areas of each image (scale bars represent 25 μm). White arrows identify BrdU and Sox-2 double-labeled cells. (B) Quantification of BrdU+/Sox-2+ cells for all treatment groups. Data represent means ± SD (n = 8). Each dot represents the mean of quantification of every sixth serial sections from an individual animal. #P < 0.05 and ##P < 0.01, as compared with the TBI group. ANOVA followed by Tukey's post-hoc test.
