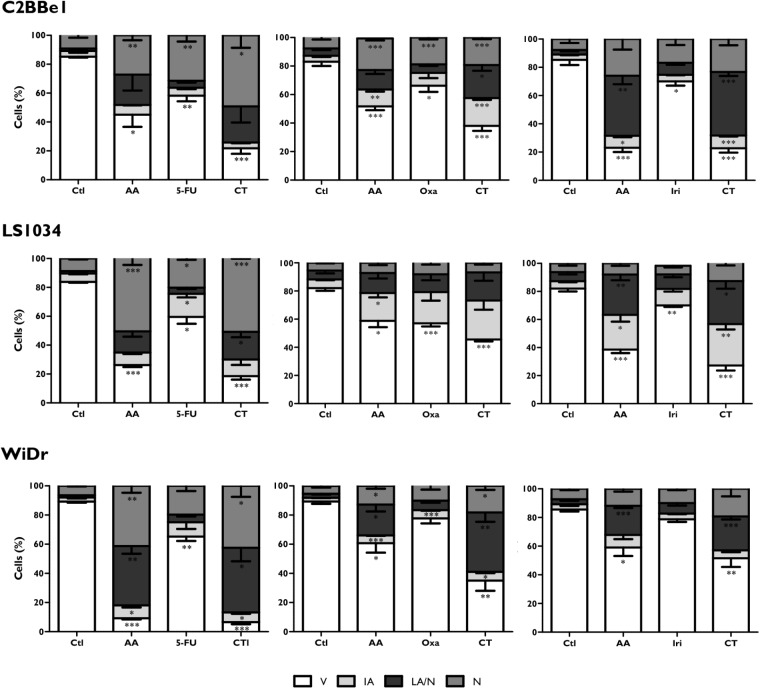
FIGURE 1.
Analysis of cell viability and types of cell death induced in C2BBe1, LS1034, and WiDr cells after exposure to AA and 5-FU, oxaliplatin (Oxa) or irinotecan (Iri) alone or in combined therapy (CT) for 48 h. The results are represented in percentage (%) of viable cells (V), initial apoptosis (IA), late apoptosis/necrosis (LA/N) and necrosis (N). The results express the mean and standard error of at least three independent experiments, in duplicate. Statistically significant differences relative to control are marked with ∗p < 0.05, ∗∗p < 0.01 and ∗∗∗p < 0.001.

