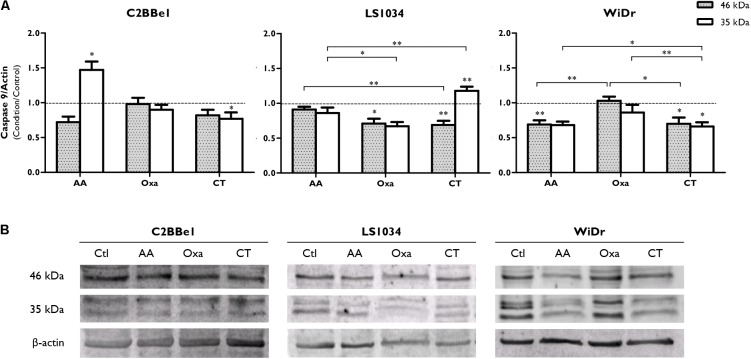
FIGURE 4.
Analysis of caspase-9 expression after exposure of C2BBe1, LS1034 and WiDr cells to AA and Oxa alone or in CT for 48 h. (A) The plot represents the expression of caspase-9 (46 kDa) and a 35 kDa cleavage product. The results are expressed as the ratio between the fluorescence intensity of caspase-9 and β-actin, normalized to the control. All results express the mean and standard error of at least six independent experiments. Statistically significant differences are marked with ∗p < 0.05 and ∗∗p < 0.01. (B) Representative immunoblot of caspase-9 expression.

