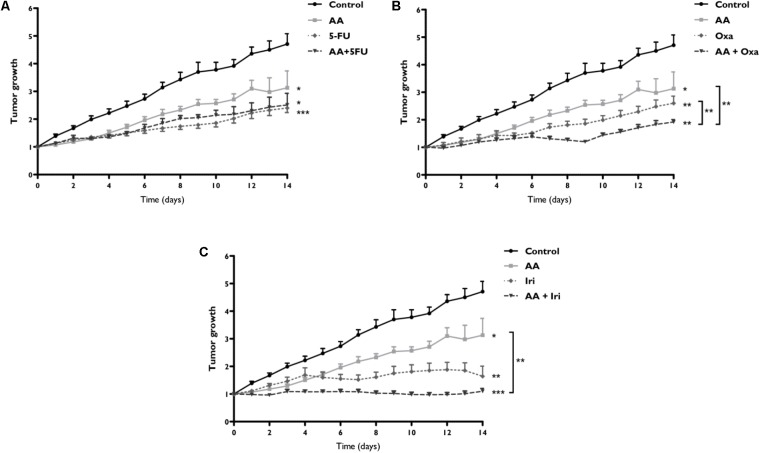
FIGURE 6.
Assessment of tumor growth after therapy with AA and 5-FU (A), Oxa (B) or Iri (C) alone or in combined therapy, in a WiDr tumor xenograft. Xenotransplanted animals were divided into eight groups: control group, not subjected to any treatment (n = 6); AA group, subjected to AA alone (n = 8); 5-FU group, subjected to 5-FU alone (n = 6); AA + 5-FU group, subjected to combination therapy of AA and 5-FU (n = 4); Oxa group, subjected to oxaliplatin alone (n = 6); AA + Oxa group, subjected to combination therapy of AA and Oxa (n = 6); Iri group, subjected to irinotecan alone (n = 6); and AA + Iri group, subjected to combination therapy of AA and Iri (n = 8). Tumor growth expresses the tumor volume relative to day 0. Statistically significant differences are marked with ∗p < 0.05, ∗∗p < 0.01, and ∗∗∗p < 0.001.

