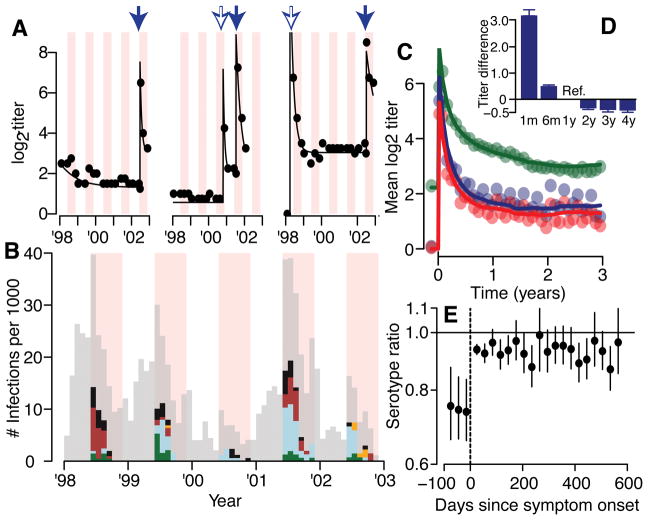
Figure 1. Titer responses following infection.
(A) Measured (dots) and model fit (lines) for three example individuals. Each dot represents the mean titer across the four serotypes. The pink shaded regions are periods of active surveillance. The solid blue arrows represent confirmed symptomatic dengue infections. The open blue arrows represent estimates of timing of subclinical infections from an augmented dataset. During the active surveillance windows, these augmented infections represent subclinical infections whereas outside the surveillance window, it is unknown if the individual had symptoms. (B) Serotype distribution of PCR confirmed symptomatic infections (DENV1 – green, DENV2 - blue, DENV3 - maroon, DENV4 – orange, unknown serotype – black). The grey bars represent the estimated distribution of infections not detected from active surveillance. The periods of active surveillance are in pink (5.5 months per year). (C) Model fit (lines) and observed (dots) titers pre and post infection for primary infections (infecting serotype in blue, non-infecting serotypes in red) and post-primary infections (green). (D) Mean difference between observed log2-titer at different time points following infection with that at 1 year for all augmented and observed infections (average of 1,421 total infections across 100 reconstructed datasets) with 95% confidence intervals. (E) Titer ratio of the infecting to the mean of the three non-infecting serotypes before and after symptom onset with 95% confidence intervals for the 217 individuals with symptomatic infections where infecting serotype detected (N=3,366 total titer measurements).

