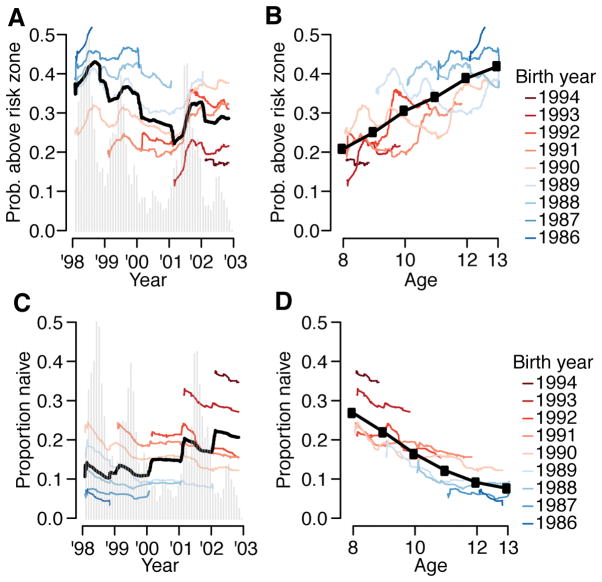
Extended Data Figure 7. Population-level distribution of titers by birth cohort and age.
(A) Proportion of cohort who are naïve as a function of time. (B) Proportion of cohort who are naïve as a function of age. Proportion of cohort with titers above risk zone (i.e., greater than 3) as a function of time (C) and age (D).

