Fig. 3.
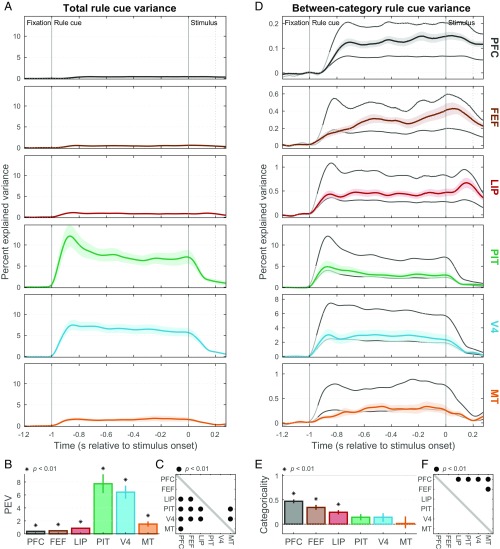
Task-rule cue representation. (A) Population mean (±SEM) total spike rate variance explained by task-rule cues (cue information) in each studied area as a function of within-trial time [referenced to the onset of the random-dot stimulus]. (B) Summary (across-time mean ± SEM) of total rule-cue variance for each area. All areas contain significant cue information (*P < 0.01). PEV, percent explained variance. (C) Cross-area comparison matrix indicating which regions (rows) had significantly greater cue information than others (columns). Dots indicate area pairs that attained significance (•P < 0.01). PIT and V4 contain significantly greater cue information than all other areas. (D) Mean (±SEM) between-category rule-cue variance (task-rule information; colored curves). Gray curves indicate expected values of this statistic corresponding to a purely categorical representation of rules (upper line) and to a purely sensory representation of rule cues (lower line). The transitions from light to dark gray in these curves indicate the estimated onset latency of overall cue information, which was used as the start of the summary epoch for each area. Note differences in y-axis ranges from A. (E) Task-rule categoricality index (±SEM) for each area, reflecting where its mean between-category rule-cue variance falls between its expected values for pure sensory (0) and categorical (1) representations. Only PFC, FEF, and LIP are significantly different from zero (*P < 0.01). (F) Cross-area comparison matrix indicating which regions (rows) had significantly greater task-rule categoricality indices than others (columns) (•P < 0.01). PFC was significantly greater than all others, except FEF.

