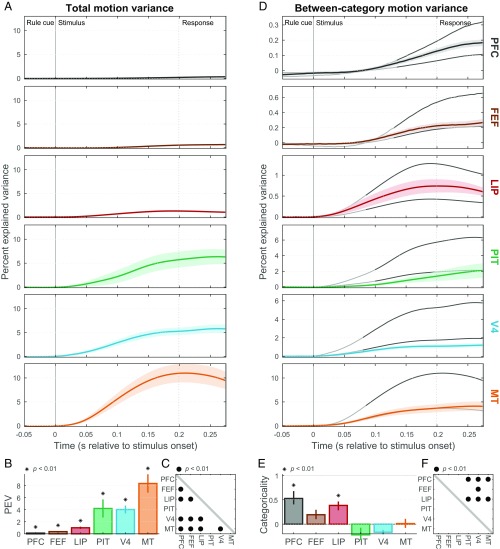
Fig. 4.
Motion direction representation. (A) Mean (±SEM) total rate variance explained by random-dot stimulus motion directions (motion information) in each area as a function of time (note different time axis from Fig. 3). (B) Summary (across-time mean ± SEM) of total motion variance for each area. All areas contain significant motion information (*P < 0.01), but it was strongest in MT. PEV, percent explained variance. (C) Cross-area comparison matrix indicating which regions (rows) had significantly greater motion information than others (columns). (D) Mean (±SEM) between-category motion variance (motion category information). Gray curves indicate expected values for purely categorical (upper line) and purely sensory (lower line) representations of motion direction. (E) Motion categoricality index (±SEM) for each area, reflecting where its average between-category motion variance falls between expected values for pure sensory (0) and categorical (1) representations. Only PFC and LIP are significantly different from zero (*P < 0.01). (F) Cross-area comparison matrix indicating which regions (rows) had significantly greater motion categoricality indices than others (columns) (•P < 0.01).

