Fig. 6.
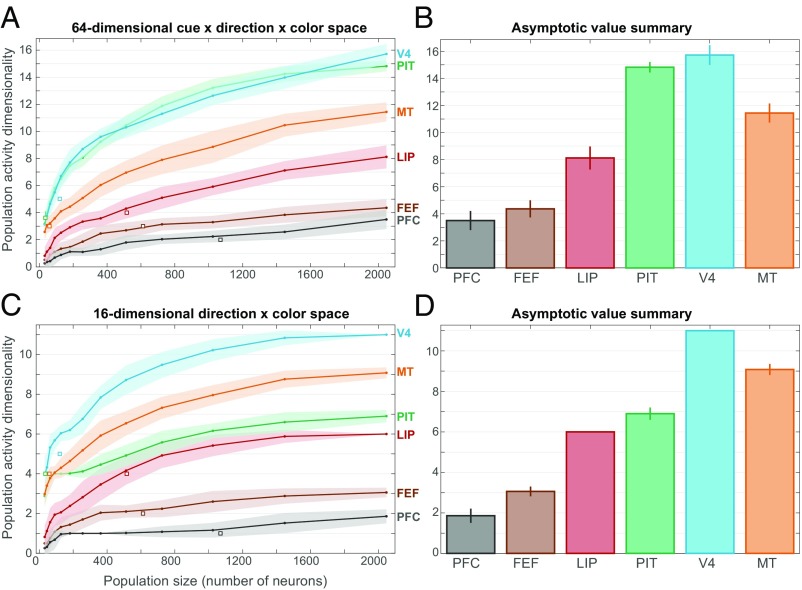
Population activity dimensionality. (A) Dimensionality (mean ± SEM) of neural population activity as a function of extrapolated population size for each studied area. Dimensionality was estimated by noise-thresholded principal components analysis within a 64D rule cue × motion direction × color space (details are provided in SI Appendix, SI Methods). Values for the actual recorded neural populations (white squares ± SEM) were largely consistent with those from the extrapolated populations. (B) Summary of asymptotic dimensionality values (±SEM) in 64D space. (C) Dimensionality (mean ± SEM) of population activity as a function of population size for each studied area. Dimensionality was estimated within a reduced 16D motion direction × color space. (D) Summary of asymptotic dimensionality values (±SEM) in 16D space. V4 and MT have the highest dimensionality, followed by PIT and LIP and then by FEF and PFC.

