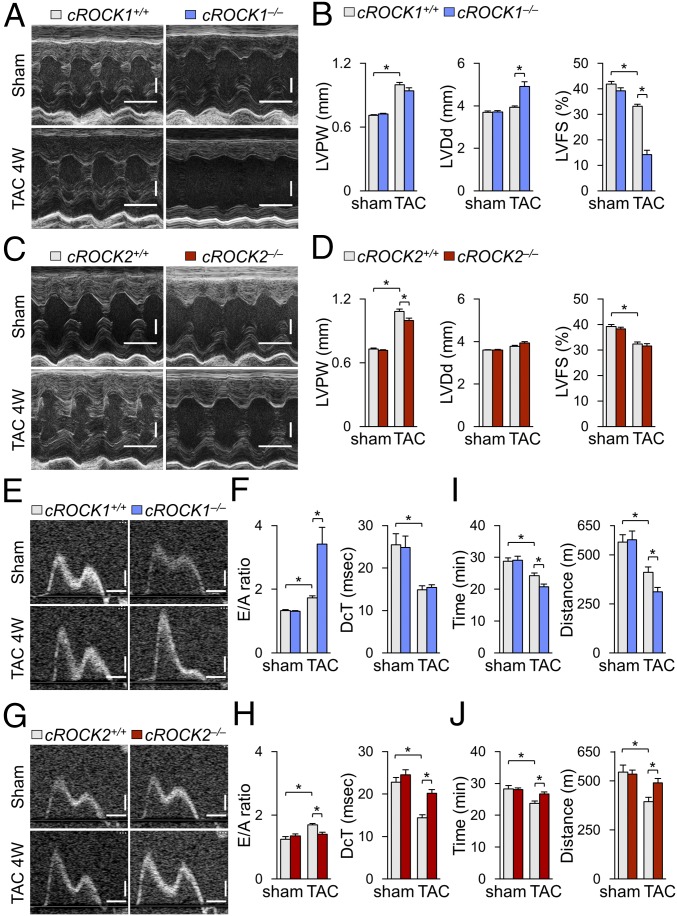
Fig. 1.
Different roles of ROCK1 and ROCK2 in response to pressure overload. (A) Representative echocardiographic M-mode images of left ventricles in cROCK1+/+ and cROCK1−/− mice 4 wk after TAC or sham operation. (Scale bars, 100 ms and 1 mm.) (B) Quantitative analysis of the parameters of cardiac function in cROCK1+/+ and cROCK1−/− mice at 4 wk after TAC (n = 12 each) or sham operation (n = 5 each). (C) Representative echocardiographic M-mode images of left ventricles in cROCK2+/+ and cROCK2−/− mice 4 wk after TAC or sham operation. (Scale bars, 100 ms and 1 mm.) (D) Quantitative analysis of the parameters of cardiac function in cROCK2+/+ and cROCK2−/− mice at 4 wk after TAC (n = 12 each) or sham operation (n = 5 each). (E) Representative echocardiographic images of mitral inflow pattern to evaluate diastolic dysfunction in cROCK1+/+ and cROCK1−/− mice 4 wk after TAC or sham operation. (Scale bars, 20 ms and 200 mm/s.) (F) Quantitative analysis of the parameters of diastolic function measured by transmitral Doppler velocity ratio of early-to-atrial wave (E/A ratio) and early wave decelation time (DcT) in cROCK1+/+ and cROCK1−/− mice at 4 wk after TAC (n = 12 each) or sham operation (n = 5 each). (G) Representative echocardiographic images of mitral inflow pattern to evaluate diastolic dysfunction in cROCK2+/+ and cROCK2−/− mice 4 wk after TAC or sham operation. (Scale bars, 20 ms and 200 mm/s.) (H) Quantitative analysis of the parameters of diastolic function measured by E/A ratio and DcT in cROCK2+/+ and cROCK2−/− mice at 4 wk after TAC (n = 12 each) or sham operation (n = 5 each). (I) Exercise tolerance evaluated by measuring running time and distance in a treadmill running test in cROCK1+/+ and cROCK1−/− mice at 4 wk after TAC (n = 12 each) or sham operation (n = 5 each). (J) Exercise tolerance evaluated by measuring walking time and distance in a treadmill test in cROCK2+/+ and cROCK2−/− mice at 4 wk after TAC (n = 12 each) or sham operation (n = 5 each). Data represent the mean ± SEM; *P < 0.05. Comparisons of parameters were performed with two-way ANOVA, followed by Tukey’s honestly significant difference test for multiple comparisons.

