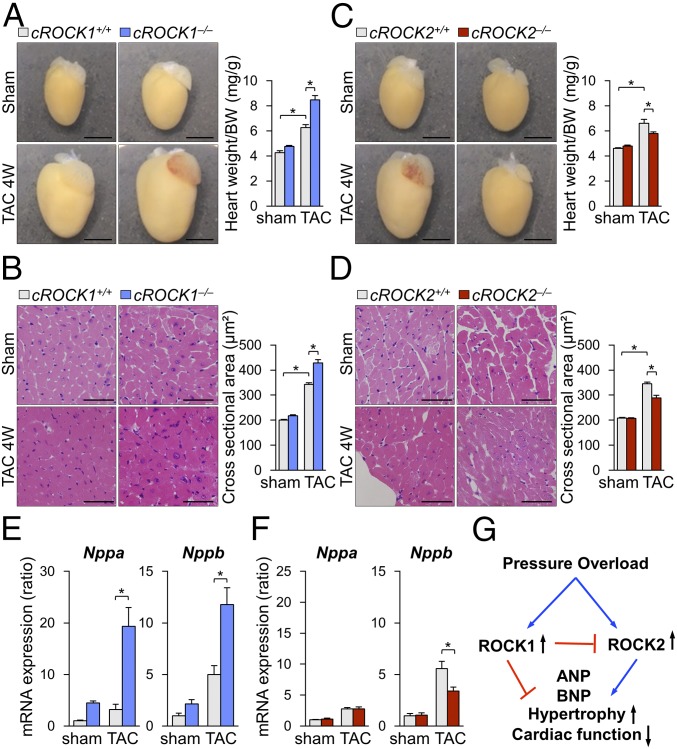
Fig. 2.
Opposite roles of ROCK1 and ROCK2 in cardiac hypertrophy. (A, Left) Representative photomicrographs of hearts from cROCK1+/+ and cROCK1−/− mice 4 wk after TAC or sham operation. (A, Right) The ratio of heart weight to body weight (BW) in cROCK1+/+ and cROCK1−/− mice at 4 wk after TAC (n = 12 each) or sham operation (n = 5 each). (Scale bars, 3 mm.) (B, Left) Representative photomicrographs of H&E staining of hearts from cROCK1+/+ and cROCK1−/− mice 4 wk after TAC or sham operation. (B, Right) Quantitative analysis of cardiomyocyte CSA in cROCK1+/+ and cROCK1−/− mice at 4 wk after TAC (n = 10 each) or sham operation (n = 5 each). (Scale bars, 50 μm.) (C, Left) Representative photomicrographs of hearts from cROCK2+/+ and cROCK2−/− mice 4 wk after TAC or sham operation. (C, Right) The ratio of heart weight to body weight (BW) in cROCK2−/− and cROCK2+/+ mice at 4 wk after TAC (n = 12 each) or sham operation (n = 5 each). (Scale bars, 3 mm.) (D, Left) Representative photomicrographs of H&E staining of hearts from cROCK2+/+ and cROCK2−/− mice 4 wk after TAC or sham operation. (D, Right) Quantitative analysis of cardiomyocyte CSA in cROCK2−/− and cROCK2+/+ mice at 4 wk after TAC (n = 10 each) or sham operation (n = 5 each). (Scale bars, 50 μm.) (E) Relative mRNA expressions of hypertrophic markers, such as natriuretic peptide A (Nppa) and natriuretic peptide B (Nppb), in cROCK1+/+ and cROCK1−/− hearts at 4 wk after TAC (n = 12 each) or sham operation (n = 5 each). (F) Relative mRNA expressions of hypertrophic markers in cROCK2+/+ and cROCK2−/− hearts at 4 wk after TAC (n = 12 each) or sham operation (n = 5 each). (G) Schematic representation of the opposite roles of ROCK1 and ROCK2 in the development of pressure-overload-induced cardiac hypertrophy. *P < 0.05. Comparisons of parameters were performed with two-way ANOVA, followed by Tukey’s honestly significant difference test for multiple comparisons.

