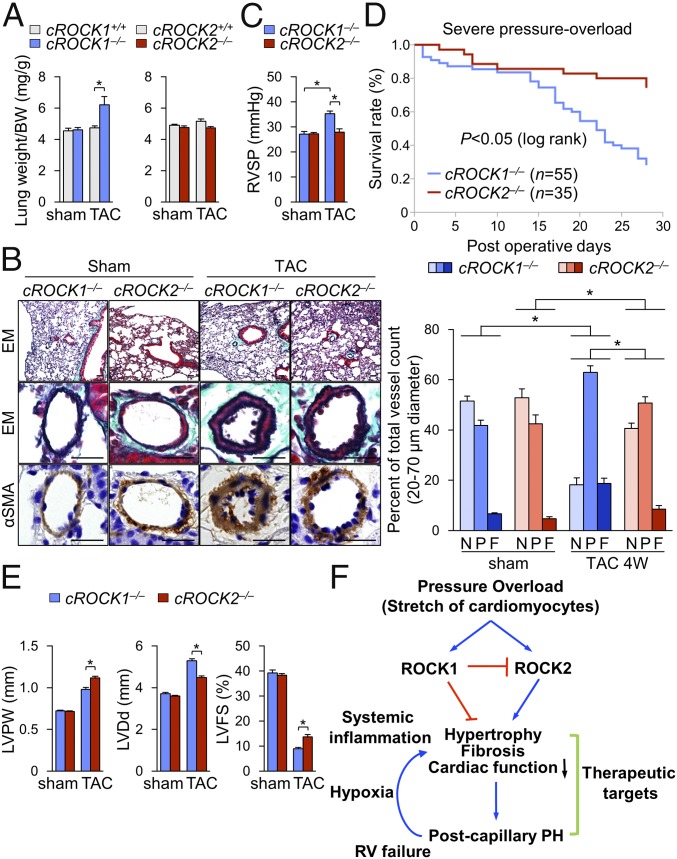
Fig. 5.
ROCK1 and ROCK2 in cardiomyocytes for postcapillary PH and survival. (A) The ratio of lung weight to body weight (BW) in cROCK1+/+, cROCK1−/−, cROCK2+/+, and cROCK2−/− mice at 4 wk after TAC (n = 12 each) or sham operation (n = 5 each). (B, Left) Representative EM and immunostaining for α-smooth muscle actin (αSMA) of the distal pulmonary arteries (PA) in cROCK1−/− and cROCK2−/− mice at 4 wk after TAC or sham operation. (Scale bars, 25 µm.) (B, Right) Muscularization ratios of distal PAs in cROCK1−/− and cROCK2−/− mice at 4 wk after TAC (n = 10 each) or sham operation (n = 5 each). F, fully muscularized vessels; N, nonmuscularized vessels; P, partially muscularized vessels. (C) RVSP in cROCK1−/− and cROCK2−/− mice at 4 wk after TAC (n = 6 each) or sham operation (n = 6 each). (D) Survival rates of cROCK1−/− (n = 55) and cROCK2−/− mice (n = 35) subjected to severe TAC. Results are expressed as log-rank test. (E) Quantitative analysis of the parameters of cardiac function assessed by echocardiography in cROCK1−/− and cROCK2−/− mice at 4 wk after severe TAC (n = 12 each) or sham operation (n = 5 each). (F) Schematic representation of the different roles of ROCK1 and ROCK2 in cardiomyocytes for the development of postcapillary PH and survival. Data represent the mean ± SEM; *P < 0.05. Comparisons of parameters were performed with two-way ANOVA followed by Tukey’s honestly significant difference test for multiple comparisons.

