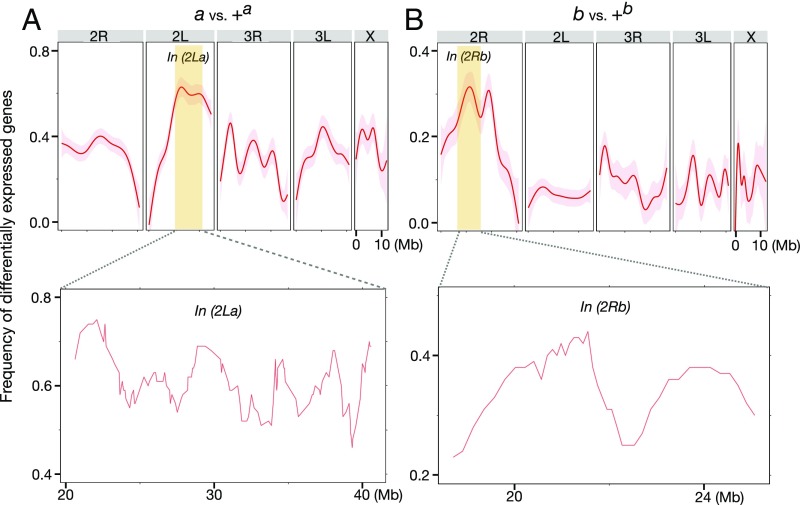
Fig. 4.
Enrichment of DEGs inside In(2La) and In(2Rb). (A and B, Upper) Curves (red lines) and 95% CIs (shaded surrounds) showing the frequency of inversion-affected DEGs along each chromosome were generated by the (stat_smooth) function of R package ggplot2. (Lower) For the focused view inside In(2La) and In(2Rb) (yellow panels), the frequency of DEGs was calculated for windows of 100 genes, slid at a step size of 10 genes. The position of each window was defined as the midpoint of the 100-gene segment.

