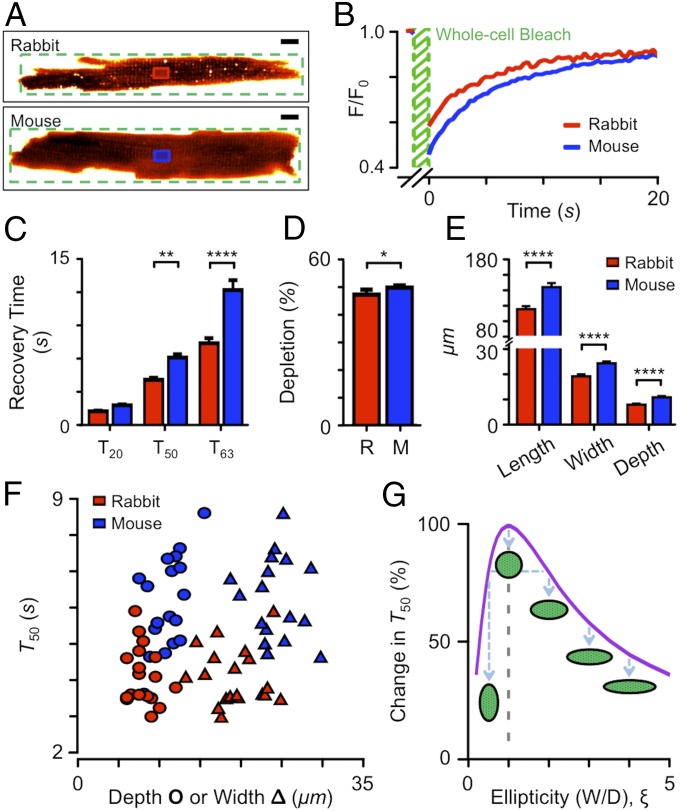
Fig. 3.
Kinetics of solute entry into t-tubules examined by FRAP with no solute flow. (A) Exemplar fluorescence images of rabbit and mouse cardiomyocytes in the ∼1-kDa test solute. The FRAP bleach region (green) and region of interest where recovery was tracked (red for rabbit, blue for mouse) are shown. (Scale bars: 10 μm.) (B) FRAP time course for a rabbit (red) and mouse (blue) cardiomyocytes. (C) Time for 20%, 50%, and 63% recovery. **P < 0.01; ****P < 0.001, two-way ANOVA with Bonferroni post hoc analysis. (D) Depth of photobleaching during FRAP. *P < 0.05, Mann–Whitney U test. (E) Length, width, and depth of cardiomyocytes used for FRAP. ****P < 0.001, for rabbit vs. mouse Mann–Whitney U test. (F) FRAP T50 as a function of cell depth (circles) or width (triangles) as measured from confocal z-sections. For C–F, red indicates rabbit (n = 18) and blue mouse (n = 18) cardiomyocytes. (G) Calculated change in T50 as a function of cell cross-section ellipticity (width/depth; illustrated by cartoons). Note that cells do not always orient conveniently on the coverslip so that both cell width (in x–y) and cell depth (in z) need to be measured.

