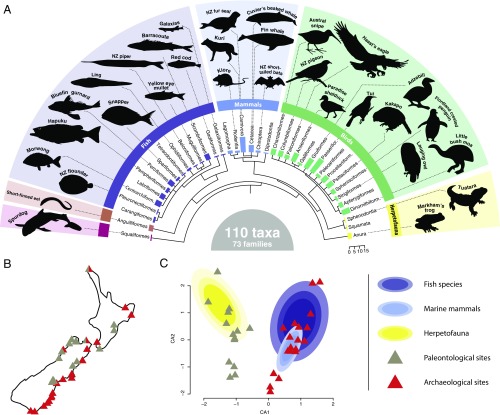
Fig. 1.
Overall biodiversity of excavated bulk bone. Species composition was analyzed using four metabarcoding assays targeting vertebrate taxa. (A) Dendrogram highlighting the diversity of orders identified in all samples, with examples of taxa identified in silhouettes. Bar sizes represent the number of taxa identified in each order. (B) Sample localities of archaeological midden sites (red triangles) and paleontological deposits (gray triangles). (C) Correspondence analysis based on presence/absence of all taxa identified from archaeological or paleontological sites. The distribution of herpetofauna (Class: Amphibia and Reptilia), fish species (Class: Actinopterygii and Chondrichthyes), and marine mammals (Family: Phocidae and Otariidae and Order: Cetacea) is highlighted by ellipses of incremental confidence intervals of 0.4, 0.6, and 0.8.

