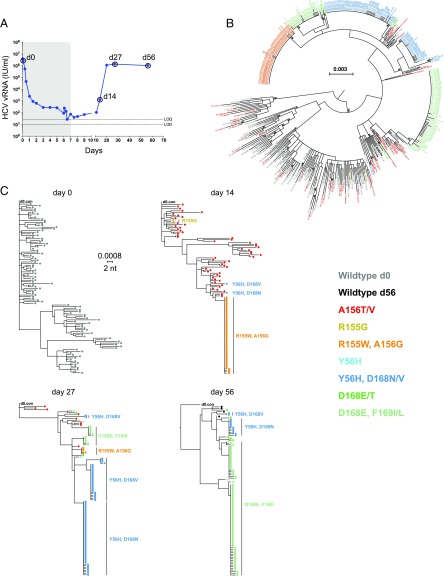
Fig. 1.
Sequential plasma virus load and sequences from subject 1. (A) Time course of treatment with MK-5172 (shaded area, days 1–7), viral load determinations (blue solid dots), and viral sequence analyses (open circles at days 0, 14, 27, and 56). (B) A maximum-likelihood (ML) phylogenetic tree of all viral sequences sampled from subject 1 from all time points. Tree tips are color coded according to the known resistant mutations they bear. (C) ML phylogenetic trees of viral sequences sampled from subject 1 at each time point.

