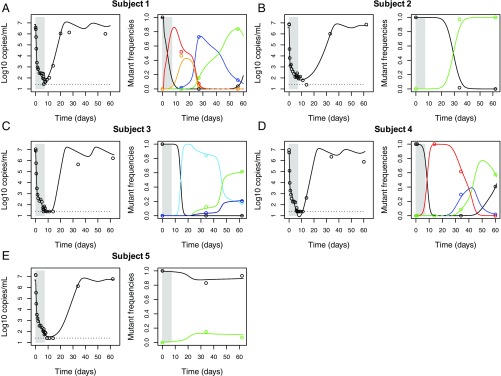
Fig. 2.
Best fit of the “full” model (lines) to the clinical data (circles) from five subjects treated with MK-5172. (A–E) Schematic diagrams of the evolutionary dynamics in subjects 1–5, respectively. A–E, the data and simulation results for viral loads are shown in open circles and black lines, respectively, on the Left; the data and simulation results for mutant frequencies are shown in colored open circles and lines, respectively, on the Right. The color coding for each mutant considered is shown in SI Appendix, Table S2.

