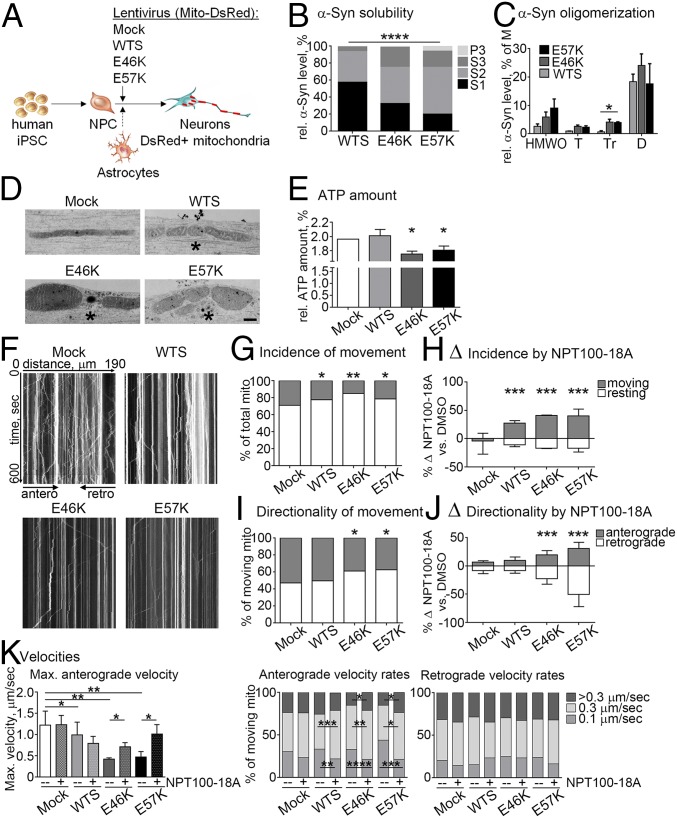
Fig. 2.
Increased α-Syn oligomerization and impaired anterograde axonal transport in iPSC-derived neurons expressing α-Syn mutants. (A) Control iPSC-derived neurons (20 d of differentiation) were infected with WTS or α-Syn mutants (E46K or E57K) and Mito-DsRed lentivirus. (B) An increase of insoluble α-Syn [Triton X-100–soluble (S2), SDS-soluble (S3), and urea/SDS-soluble (P3) fractions] was observed in E57K and E46K neurons. S1, a detergent-free soluble fraction. (C) Soluble α-Syn multimers were analyzed by size exclusion chromatography. Soluble α-Syn trimers (Tr) were significantly increased in E46K and E57K lysates compared with WTS. D, dimers; HMWO, higher-molecular-weight oligomers; M, monomers; T, tetramers. (D) Clustering (asterisks) and shortening of mitochondria in neurites with α-Syn oligomers (E46K, E57K) compared with elongated mitochondria in control neurons (Mock). (Scale bar: 500 nm.) (E) ATP levels were significantly reduced in neurons expressing the α-Syn mutants E46K and E57K. (F) Representative kymographs. (G) Less frequently moving mitochondria were found in all α-Syn overexpressing neurons and (H) can be restored by NPT100-18A. Positive deltas indicate an increase and negative deltas indicate a decrease of a value in NPT100-18A compared with DMSO (diluent control in all NPT100-18A experiments). (I) Neurons expressing α-Syn mutants (E46K and E57K) revealed a lower incidence of anterograde axonal transport, which was significantly increased by NPT100-18A (J). (K) Decreased maximal (max.) anterograde velocities in WTS, E46K, and E57K neurons, which were improved by NPT100-18A in α-Syn mutant neurons (Left). NPT100-18A reduced slow-moving (0.1 µm/s) and increased middle-speed (0.3 µm/s) anterograde mitochondria frequencies in WTS, E46K, and E57K neurons (Middle). Significant increase of fast-moving (>0.3 µm/s) anterograde mitochondria by NPT100-18A was observed in E46K and E57K neurons (Middle). No changes of retrograde axonal transport were detected independently of NPT100-18A usage (Right). *P ≤ 0.05, **P ≤ 0.01, ***P ≤ 0.001, ****P ≤ 0.0001. Data are presented as mean ± SD in H, J, and K and as mean ± SEM in C. Data from two independent iPSC clones from Ctrl1 are presented collectively in H, J, and K.

