Fig. 5.
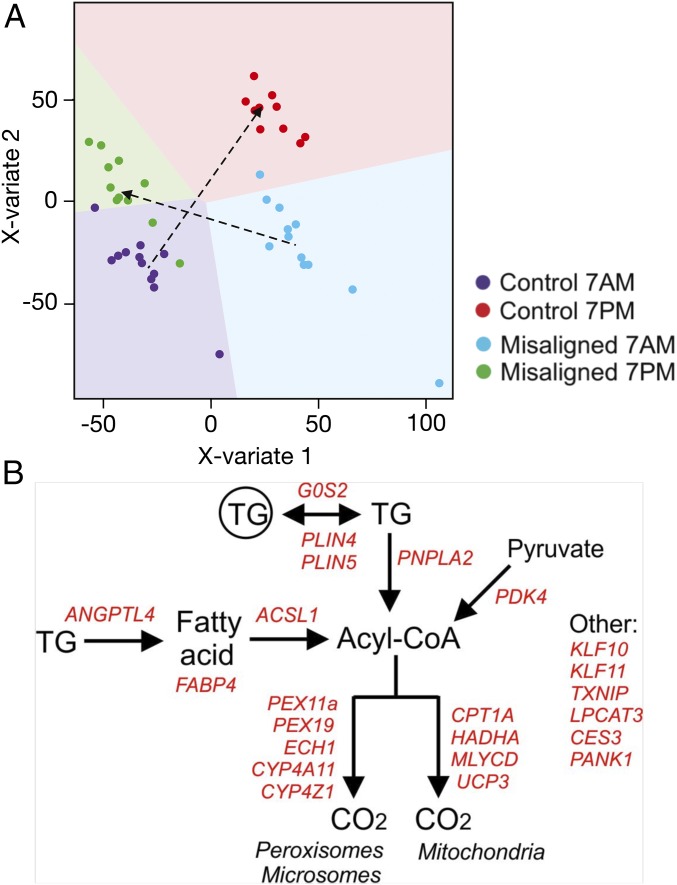
Global gene expression analysis indicates up-regulated PPAR target genes. (A) Multilevel PLS-DA of the transcriptome data indicates similar expression changes between participants. Sample prediction area plots from a PLS-DA model applied on the transcriptome data set with the expression levels of all 29,526 genes in 47 samples. Almost all samples could be correctly classified into four classes that represented the four conditions for each individual subject [control condition (7 AM and 7 PM) and misaligned condition (7 AM and 7 PM)]. Each point represents one array of a participant at one time point. Background color indicates the two-dimensional representation of the predicted classification space of the four classes (conditions), and show that only 3 of the 47 samples were misclassified. (B) Positively enriched genes in the geneset “human PPAR targets” that were significantly up-regulated at 7 PM in the misaligned condition compared with 7 AM in the control condition (representing the timepoints of the clamp) (P < 0.05) were positioned in a biochemical map of cellular lipid metabolism.

