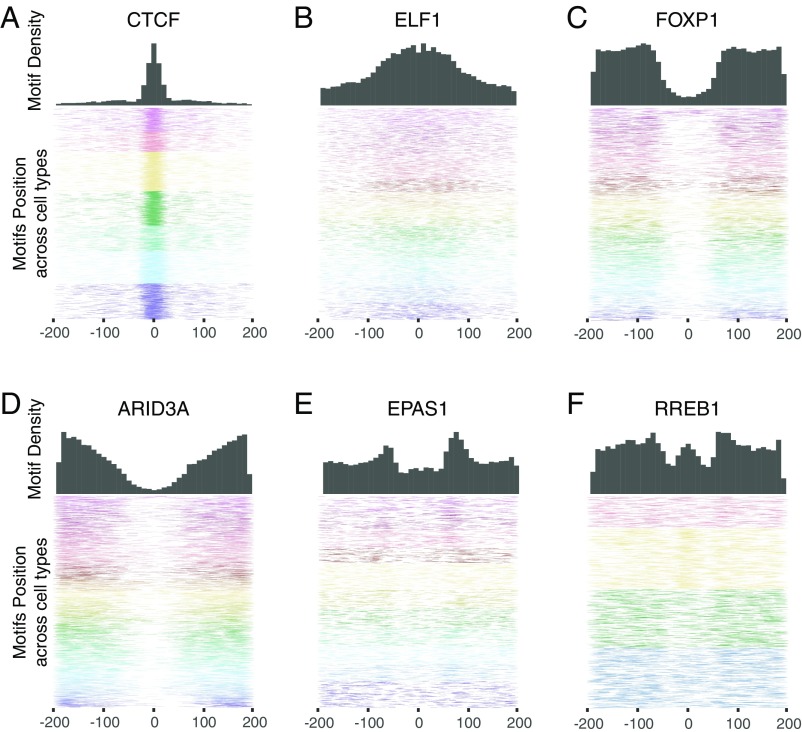
Fig. 2.
Positional binding patterns of TF motifs show striking differences. Distribution of the position of motif sites for CTCF (A), ELF1 (B), FOXP1 (C), ARID3A (D), EPAS1 (E), and RREB1 (F) across NDR regions, centered around the peak of the DHS signal. (Upper) Histograms show the density of motif sites in 10-bp bins tiled across the NDR. (Lower) Heatmaps show the position of 10,000 motif sites in NDRs. Colors indicate motif sites in different cell types (see SI Appendix, Fig. S5 for the color key).

