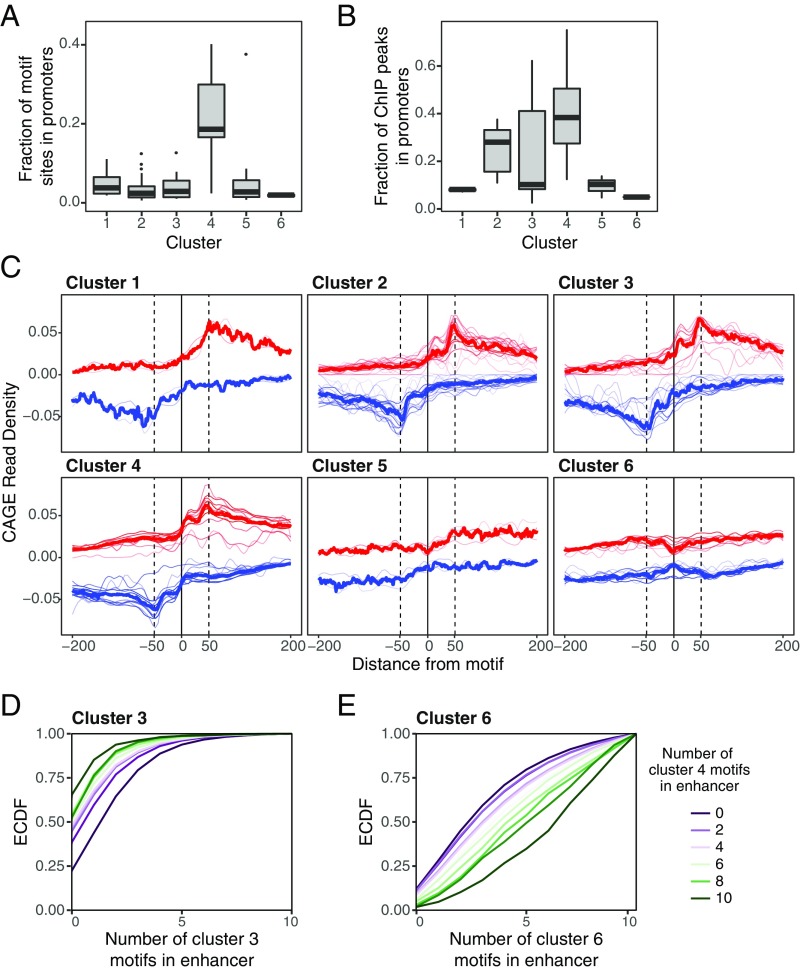
Fig. 5.
TFs in cluster 4 are enriched in promoters and are associated with transcriptional initiation. (A) The fraction of motif sites in NDRs in our analysis that occur in promoters (<1 kb upstream of the annotated TSS) for TFs in each cluster. (B) The fraction of ChIP-seq peaks for TFs in each cluster that overlap promoter (data for 39 TFs profiled in ENCODE are included). Cluster 4 motifs and TF binding occur in promoters far more frequently than do motifs in other clusters. (C) Composite of CAGE reads on the plus strand (red) and minus strand (blue) aligned to the center of each TF motif. Thin red and blue lines correspond to CAGE profiles of individual TF motifs, and thick red and blue lines show the average CAGE profile of all motifs in the cluster. Motifs in clusters 3 and 4 show a peak of transcriptional initiation at the location of the motif site. (D and E) Empirical cumulative distribution function (ECDF) of the number of cluster 3 (D) and cluster 6 (E) motif sites in NDRs, conditional on the number of cluster 4 motifs. NDRs with cluster 4 motif sites are coenriched with cluster 3 motif sites and depleted of cluster 6 motif sites.

