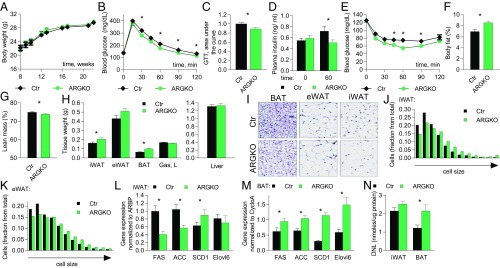
Fig. 3.
ARGKO mice display increased nutrient partitioning into fat depots; 12 mice per group unless indicated otherwise. (A) Body weight. (B–G) The experiments are performed in 8-wk-old mice. (B and C) Glucose tolerance test (GTT) after 6-h fast (B) and area under the curve (C). (D) Insulin levels before and during GTT. (E) Insulin tolerance test after 3-h fast. (F and G) Body fat (F) and lean mass (G) measured by NMR. (H–M) The experiments were performed after 6-h fast in 23-wk-old mice. (H) Tissue weights. (I–K) H&E staining and quantitation of cell size of indicated fat depots; 10 images per group. (L and M) qPCR from iWAT (L) and BAT (M). (N) DNL in indicated tissues; six mice per group. The data are presented as mean ± SEM; *P < 0.05.

