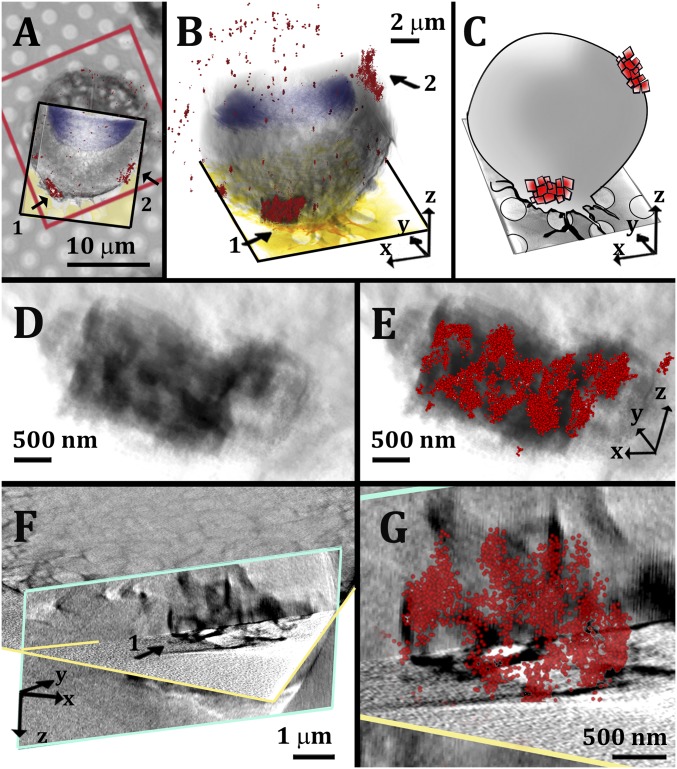
Fig. 2.
Correlative STORM/cryo-SXT imaging of micrometer-size cholesterol crystal aggregates associated with cell membranes. (A) Superimposition of a bright-field image of a cell with the corresponding STORM data (red frame) and the 3D volume rendering of the SXT segmented data (black frame). The different features of the STORM and SXT are highlighted using arbitrary colors: STORM localization map, red clusters 1 and 2; cell nucleus, blue-purple; cell volume, gray. The grid foil is colored in yellow in the slice through the 3D reconstruction of the cell tomogram. (B) The 3D overlaid SXT and STORM segmented data of the same cell, from a side view. Cluster labeled with arrow 1 is followed from D to G. (C) Cartoon rendering of the overlaid data in B. (D) High magnification of the segmented volume of aggregate 1 in approximately the same orientation as in B. (E) The same volume as in D superimposed with the corresponding STORM data (red). (F) Slices through the reconstructed SXT data used to visualize the crystal profiles identified by the cluster in STORM. The xy slice (profiled in yellow) is combined with a perpendicular slice (profiled in light blue). (G) High magnification of aggregate 1 in F, superimposed with the corresponding STORM data (red).

